目录:
1)背景介绍
2)方案分析
3)实现细节
4)监控告警
5)日志收集
6)测试
一、背景介绍
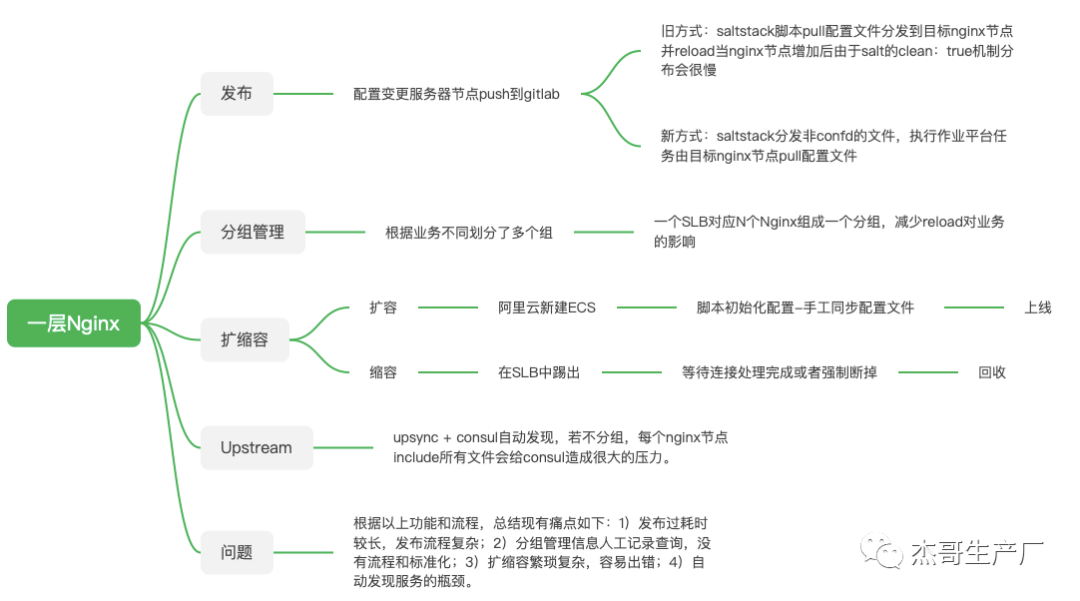
如下图所示,传统方式部署一层Nginx,随着业务扩大,维护管理变得复杂,繁琐,耗时耗力和易出错等问题。我们的Nginx是有按照业务来分组的,不同的业务使用不同分组的Nginx实例区分开。通过nginx.conf中include不同分组的配置文件来实现。

如果有一种方式可以简化Nginx的部署,扩缩容的管理。日常只需关注nginx的配置文件发布上线即可。当前最受欢迎的管理模式莫过于容器化部署,而nginx本身也是无状态服务,非常适合这样的场景。于是,通过一个多月的设计,实践,测试。最终实现了Nginx的“上云”。
二、方案分析
1)架构图如下所示:
2)整体流程:
在发布机(nginx003)上的对应目录修改配置后,推送最新配置到gitlab仓库,我们会有一个reloader的
容器,每10s 拉取gitlab仓库到本地pod,pod中会根据nginx.conf文件include的
对象 /usr/local/nginx/conf-configmap/中是否有include该分组来判断是否进行reload 。
三、实现细节
在K8S上部署Nginx实例,由于Nginx是有分组管理的。所以我们使用一个Deployment对应一个分组,Deployment的yaml声明文件除了名称和引用的include文件不一样之外,其他的配置都是一样的。 一个Deployment根据分组的业务负载了来设定replicas数量,每个pod由四个容器组成。包括:1个initContainer容器init-reloader和3个业务容器nginx,reloader和nginx-exporter。下面,我们着重分析每个容器实现的功能。
1)init-reloader容器
这个容器是一个initContainer容器,是做一些初始化的工作。
1.1)镜像:
cat Dockerfile
FROM fulcrum/ssh-git:latest
COPY init-start.sh /init-start.sh
COPY start.sh /start.sh
COPY Dockerfile /Dockerfile
RUN apk add –no-cache tzdata ca-certificates libc6-compat inotify-tools bc bash && echo ‘hosts: files mdns4_minimal [NOTFOUND=return] dns mdns4’ >> /etc/nsswitch.conf && ln -sf /usr/share/zoneinfo/Asia/Shanghai /etc/localtime && echo “Asia/Shanghai” >> /etc/timezone
1.2)执行init-start.sh脚本
功能:
(1)从仓库拉取最新配置并cp 至/usr/local/nginx/conf.d/目录
(2)创建代理缓存相关的目录/data/proxy_cache_path/
(3)在/usr/local/nginx/conf/servers/下创建对应的对应的conf 文件记录后端服务 realserver:port
2)nginx-exporter容器
该容器是实现对接prometheus监控nginx的exporter
2.1)镜像:
cat Dockerfile
FROM busybox:1.28
COPY nginx_exporter /nginx_exporter/nginx_exporter
COPY start.sh /start.sh
ENV start_cmd=”/nginx_exporter/nginx_exporter -nginx.scrape-uri http://127.0.0.1:80/ngx_status”
2.2)执行start.sh脚本
功能
(1) num=$(netstat -anlp | grep -w 80 | grep nginx | grep LISTEN | wc -l)
(2) /nginx_exporter/nginx_exporter -nginx.scrape-uri http://127.0.0.1:80/ngx_status
3)nginx容器
该容器是openresty实例的业务容器
3.1)镜像
FROM centos:7.3.1611
COPY Dockerfile /dockerfile/
COPY sysctl.conf /etc/sysctl.conf
USER root
RUN yum install -y logrotate cronie initscripts bc wget git && yum clean all
ADD nginx /etc/logrotate.d/nginx
ADD root /var/spool/cron/root
ADD kill_shutting_down.sh /kill_shutting_down.sh
ADD etc-init.d-nginx /etc-init.d-nginx
COPY openresty.zip /usr/local/openresty.zip
COPY start.sh /start.sh
COPY reloader-start.sh /reloader-start.sh
RUN chmod +x /start.sh /kill_shutting_down.sh reloader-start.sh && unzip /usr/local/openresty.zip -d /usr/local/ && cd /usr/local/openresty && echo “y” | bash install.sh && rm -rf /usr/local/openresty /var/cache/yum && localedef -c -f UTF-8 -i zh_CN zh_CN.utf8 && mkdir -p /usr/local/nginx/conf/servers && chmod -R 777 /usr/local/nginx/conf/servers && cp -f /etc-init.d-nginx /etc/init.d/nginx && chmod +x /etc/init.d/nginx
ENTRYPOINT [“/start.sh”]
3.2)执行start.sh脚本
功能:
(1)启动crond定时任务实现日志轮转
(2)判断目录(/usr/local/nginx/conf.d) 不为空,启动nginx
4)reloader容器
改容器是实现发布流程逻辑的辅助容器
4.1)镜像和nginx容器一样
4.2)执行reloader-start.sh脚本
功能:
(1)get_reload_flag函数
通过对比/gitrepo/diff.files 文件 改变的文件名和/usr/local/nginx/conf-configmap/中 是否include 此文件名发生改变的分组 来判断是否需要reload (flag=1 则reload)
(2)check_mem函数
判断内存少于30% 返回1
(3)kill_shutting_down函数
先执行内存剩余量判断,如果小于30%,杀掉shutdown 进程
(4)nginx_force_reload函数(只会进行reload)
kill -HUP ${nginxpid}
(5)reload函数
(5.1) 首先将仓库中的配置文件cp至/usr/local/nginx/conf.d ;
(5.2) /usr/local/nginx/conf.d不为空时
创建proxy_cache_path 目录—/usr/local/nginx/conf/servers/文件— nginx -t —kill_shutting_down —–nginx_force_reload
总结整体实现流程如下 :
1)拉取仓库pull 重命名旧的commit id 文件(/gitrepo/local_current_commit_id.old),并生成获取新的commit id(/gitrepo/local_current_commit_id.new);
2)通过对比old和new commit id 获得发生了变更文件到/gitrepo/diff.files ;
3)然后调用 et_reload_flag 判断改组nginx是否需要reload
4)如果/gitrepo/diff.files中有“nginx_force_reload” 字段 然后kill_shutting_down — nginx_force_reload
5)Deployment的实现
通过实现以上容器的功能后,打包成镜像用于部署。以下是Deployment的yaml详细内容:apiVersion: apps/v1
kind: Deployment
metadata:
labels:
app: slb-nginx-group01
name: slb-nginx-group01
namespace: slb-nginx
spec:
replicas: 3 // 3个副本数,即:3个pod
selector:
matchLabels:
app: slb-nginx-group01
strategy: // 滚动更新的策略,
rollingUpdate:
maxSurge: 25%
maxUnavailable: 1
type: RollingUpdate
template:
metadata:
labels:
app: slb-nginx-group01
exporter: nginx
annotations: // 注解,实现和prometheus的对接
prometheus.io/path: /metrics
prometheus.io/port: “9113”
prometheus.io/scrape: “true”
spec:
nodeSelector: // 节点label选择
app: slb-nginx-label-group01
tolerations: // 容忍度设置
– key: “node-type”
operator: “Equal”
value: “slb-nginx-label-group01”
effect: “NoExecute”
affinity: // pod的反亲和性,尽量部署到阿里云不同的可用区
podAntiAffinity:
preferredDuringSchedulingIgnoredDuringExecution:
– weight: 100
podAffinityTerm:
labelSelector:
matchExpressions:
– key: app
operator: In
values:
– slb-nginx-group01
topologyKey: “failure-domain.beta.kubernetes.io/zone”
shareProcessNamespace: true // 容器间进程空间共享
hostAliases: // 设置hosts
– ip: “xxx.xxx.xxx.xxx”
hostnames:
– “www.test.com”
initContainers:
– image: www.test.com/library/reloader:v0.0.1
name: init-reloader
command: [“/bin/sh”]
args: [“/init-start.sh”]
env:
– name: nginx_git_repo_address
value: “git@www.test.com:psd/nginx-conf.git”
volumeMounts:
– name: code-id-rsa
mountPath: /root/.ssh/code_id_rsa
subPath: code_id_rsa
– name: nginx-shared-confd
mountPath: /usr/local/nginx/conf.d/
– name: nginx-gitrepo
mountPath: /gitrepo/
containers:
– image: www.test.com/library/nginx-exporter:v0.4.2
name: nginx-exporter
command: [“/bin/sh”, “-c”, “/start.sh”]
resources:
limits:
cpu: 50m
memory: 50Mi
requests:
cpu: 50m
memory: 50Mi
volumeMounts:
– name: time-zone
mountPath: /etc/localtime
terminationMessagePath: /dev/termination-log
terminationMessagePolicy: File
– image: www.test.com/library/openresty:1.13.6
name: nginx
command: [“/bin/sh”, “-c”, “/start.sh”]
lifecycle:
preStop:
exec:
command:
– sh
– -c
– sleep 10
livenessProbe:
failureThreshold: 3
initialDelaySeconds: 90
periodSeconds: 3
successThreshold: 1
httpGet:
path: /healthz
port: 8999
timeoutSeconds: 4
readinessProbe:
failureThreshold: 3
initialDelaySeconds: 4
periodSeconds: 3
successThreshold: 1
tcpSocket:
port: 80
timeoutSeconds: 4
resources:
limits:
cpu: 8
memory: 8192Mi
requests:
cpu: 2
memory: 8192Mi
terminationMessagePath: /dev/termination-log
terminationMessagePolicy: File
volumeMounts:
– name: nginx-start-shell
mountPath: /start.sh
subPath: start.sh
readOnly: true
– name: conf-include
mountPath: /usr/local/nginx/conf-configmap/
– name: nginx-shared-confd
mountPath: /usr/local/nginx/conf.d/
– name: nginx-logs
mountPath: /data/log/nginx/
– name: data-nfs-webroot
mountPath: /data_nfs/WebRoot
– name: data-nfs-httpd
mountPath: /data_nfs/httpd
– name: data-nfs-crashdump
mountPath: /data_nfs/crashdump
– name: data-cdn
mountPath: /data_cdn
– image: www.test.com/library/openresty:1.13.6
name: reloader
command: [“/bin/sh”, “-c”, “/reloader-start.sh”]
env:
– name: nginx_git_repo_address
value: “git@www.test.com:psd/nginx-conf.git”
– name: MY_MEM_LIMIT
valueFrom:
resourceFieldRef:
containerName: nginx
resource: limits.memory
securityContext:
capabilities:
add:
– SYS_PTRACE
resources:
limits:
cpu: 100m
memory: 550Mi
requests:
cpu: 100m
memory: 150Mi
terminationMessagePath: /dev/termination-log
terminationMessagePolicy: File
volumeMounts:
– name: code-id-rsa
mountPath: /root/.ssh/code_id_rsa
subPath: code_id_rsa
readOnly: true
– name: reloader-start-shell
mountPath: /reloader-start.sh
subPath: reloader-start.sh
readOnly: true
– name: conf-include
mountPath: /usr/local/nginx/conf-configmap/
– name: nginx-shared-confd
mountPath: /usr/local/nginx/conf.d/
– name: nginx-gitrepo
mountPath: /gitrepo/
volumes:
– name: code-id-rsa
configMap:
name: code-id-rsa
defaultMode: 0600
– name: nginx-start-shell
configMap:
name: nginx-start-shell
defaultMode: 0755
– name: reloader-start-shell
configMap:
name: reloader-start-shell
defaultMode: 0755
– name: conf-include
configMap:
name: stark-conf-include
– name: nginx-shared-confd
emptyDir: {}
– name: nginx-gitrepo
emptyDir: {}
– name: nginx-logs
emptyDir: {}
– name: time-zone
hostPath:
path: /etc/localtime
– name: data-nfs-webroot
nfs:
server: xxx.nas.aliyuncs.com
path: “/WebRoot”
– name: data-nfs-httpd
nfs:
server: xxx.nas.aliyuncs.com
path: “/httpd”
– name: data-nfs-crashdump
nfs:
server: xxx.nas.aliyuncs.com
path: “/crashdump”
– name: data-cdn
persistentVolumeClaim:
claimName: oss-pvc
如上所示,deployment的关键配置有:nodeSelector,tolerations,pod反亲和性affinity,shareProcessNamespace,资源限制(是否超卖),容器实名周期lifecycle,存活探针livenessProbe,就绪探针readinessProbe,安全上下文授权securityContext和存储挂载(NFS,OSS,emptyDir和configmap的挂载)。
6)对接阿里云SLB的service声明文件:
cat external-group01-svc.yaml
apiVersion: v1
kind: Service
metadata:
annotations:
service.beta.kubernetes.io/alibaba-cloud-loadbalancer-id: “xxx”
#service.beta.kubernetes.io/alibaba-cloud-loadbalancer-force-override-listeners: “true”
service.beta.kubernetes.io/alibaba-cloud-loadbalancer-scheduler: “wrr”
service.beta.kubernetes.io/alibaba-cloud-loadbalancer-remove-unscheduled-backend: “on”
name: external-grou01-svc
namespace: slb-nginx
spec:
externalTrafficPolicy: Local
ports:
- port: 80
name: http
protocol: TCP
targetPort: 80 - port: 443
name: https
protocol: TCP
targetPort: 443
selector:
app: slb-nginx-group01
type: LoadBalancer
cat inner-group01-svc.yaml
apiVersion: v1
kind: Service
metadata:
annotations:
service.beta.kubernetes.io/alibaba-cloud-loadbalancer-id: “xxx”
service.beta.kubernetes.io/alibaba-cloud-loadbalancer-scheduler: “wrr”
service.beta.kubernetes.io/alibaba-cloud-loadbalancer-remove-unscheduled-backend: “on”
name: inner-stark-svc
namespace: slb-nginx
spec:
externalTrafficPolicy: Local
ports:
- port: 80
name: http
protocol: TCP
targetPort: 80 - port: 443
name: https
protocol: TCP
targetPort: 443
selector:
app: slb-nginx-group01
type: LoadBalancer
如上所示,对接阿里云SLB分别创建内网外的service。通过注解指定使用的负载均衡算法,指定的SLB,以及是否覆盖已有监听。externalTrafficPolicy参数指定SLB的后端列表只有部署了pod的宿主机。部署后可在阿里云SLB控制台查看负载情况。
四、监控告警
在集群中以prometheus-operator方式部署监控系统,配置监控有两种方式。分别如下:
1)第一种:创建service和ServiceMonitor来实现:
// 创建service
cat slb-nginx-exporter-svc.yaml
apiVersion: v1
kind: Service
metadata:
name: slb-nginx-exporter-svc
labels:
app: slb-nginx-exporter-svc
namespace: slb-nginx
spec:
type: ClusterIP
ports:
– name: exporter
port: 9113
targetPort: 9113
selector:
exporter: nginx // 这里的selector对应depolyment中的label
// 创建ServiceMonitor
cat nginx-exporter-serviceMonitor.yaml
apiVersion: monitoring.coreos.com/v1
kind: ServiceMonitor
metadata:
labels:
k8s-app: nginx-exporter
name: nginx-exporter
namespace: monitoring
spec:
selector:
matchLabels:
app: slb-nginx-exporter-svc //这里的选择的label和service对应
namespaceSelector:
matchNames:
– slb-nginx
endpoints:
- interval: 3s
port: “exporter” //这里port的名称也需要和service对应
scheme: http
path: ‘/metrics’
jobLabel: k8s-nginx-exporter
创建完这两个资源后,prometheus会自动添加生效以下配置:
kubectl -n monitoring exec -ti prometheus-k8s-0 -c prometheus — cat /etc/prometheus/config_out/prometheus.env.yaml
…
scrape_configs:
- job_name: monitoring/nginx-exporter/0
honor_labels: false
kubernetes_sd_configs: - role: endpoints namespaces: names:
- slb-nginx
scrape_interval: 3s
metrics_path: /metrics
scheme: http
relabel_configs:
- slb-nginx
- action: keep source_labels:
- __meta_kubernetes_service_label_app
regex: slb-nginx-exporter-svc
- __meta_kubernetes_service_label_app
- action: keep source_labels:
- __meta_kubernetes_endpoint_port_name
regex: exporter
- __meta_kubernetes_endpoint_port_name
- source_labels:
- __meta_kubernetes_endpoint_address_target_kind
- __meta_kubernetes_endpoint_address_target_name
separator: ;
regex: Node;(.*)
replacement: ${1}
target_label: node
- source_labels:
- __meta_kubernetes_endpoint_address_target_kind
- __meta_kubernetes_endpoint_address_target_name
separator: ;
regex: Pod;(.*)
replacement: ${1}
target_label: pod
- source_labels:
- __meta_kubernetes_namespace
target_label: namespace
- __meta_kubernetes_namespace
- source_labels:
- __meta_kubernetes_service_name
target_label: service
- __meta_kubernetes_service_name
- source_labels:
- __meta_kubernetes_pod_name
target_label: pod
- __meta_kubernetes_pod_name
- source_labels:
- __meta_kubernetes_service_name
target_label: job
replacement: ${1}
- __meta_kubernetes_service_name
- source_labels:
- __meta_kubernetes_service_label_k8s_nginx_exporter
target_label: job
regex: (.+)
replacement: ${1}
- __meta_kubernetes_service_label_k8s_nginx_exporter
- target_label: endpoint
replacement: exporter
…
这样,监控数据就被采集到prometheus中了。可以配置对应的告警规则了。如下:
2)第二种:直接在prometheus添加对应的配置来实现:
// 在deployment中添加如下pod的annotation
annotations:
prometheus.io/path: /metrics
prometheus.io/port: “9113”
prometheus.io/scrape: “true”
// 添加role:pods的配置,prometheus会自动去采集数据
- job_name: ‘slb-nginx-pods’
honor_labels: false
kubernetes_sd_configs: - role: pod
tls_config:
insecure_skip_verify: true
relabel_configs: - target_label: dc
replacement: guangzhou - target_label: cluster
replacement: guangzhou-test2 - source_labels: [__meta_kubernetes_pod_annotation_prometheus_io_scrape] // 以下三个参数和annotation想对应
action: keep
regex: true - source_labels: [meta_kubernetes_pod_annotation_prometheus_io_path] action: replace target_label: __metrics_path
regex: (.+) - source_labels: [address, meta_kubernetes_pod_annotation_prometheus_io_port] action: replace regex: ([^:]+)(?::d+)?;(d+) replacement: $1:$2 target_label: __address
- action: labelmap
regex: _meta_kubernetes_pod_label(.+) - source_labels: [__meta_kubernetes_namespace]
action: replace
target_label: kubernetes_namespace - source_labels: [__meta_kubernetes_pod_name]
action: replace
target_label: kubernetes_pod_name
// 添加告警规则
cat slb-nginx-pods.rules
groups:
- name: “内网一层Nginx pods监控”
rules: - alert: 内网Nginx pods 实例down
expr: nginx_up{dc=”guangzhou”,namespace=”slb-nginx”} == 0
for: 5s
labels:
severity: 0
key: “nginx-k8s”
annotations:
description: “5秒钟内一层Nginx {{ $labels.instance }} 发生宕机.”
summary: “内网k8s1.18集群{{ $labels.namespace }} 名称空间下的pod: {{ $labels.pod }} down”
hint: “登录内网k8s1.18集群查看{{ $labels.namespace }} 名称空间下的pod: {{ $labels.pod }} 是否正常。或者联系k8s管理员进行处理。”
测试告警如下:
五、日志收集
日志收集通过在K8S集群中部署DaemonSet实现收集每个节点上的Nginx和容器日志。这里使用Filebeat做收集,然后发送到Kafka集群,再由Logstash从Kafka中读取日志过滤后发送到ES集群。最后通过Kibana查看日志。
流程如下:

        Filebeat --> Kafka --> Logstash --> ES --> Kibana


    1)部署

Filebeat的DaemonSet部署yaml内容:
cat filebeat.yml
filebeat.inputs:
- type: container enabled: true ignore_older: 1h paths:
- /var/log/containers/slb-nginx-*.log
fields:
nodeIp: ${node_ip}
kafkaTopic: ‘log-collect-filebeat’
fields_under_root: true
processors: - add_kubernetes_metadata:
host: ${node_name}
default_indexers.enabled: false
default_matchers.enabled: false
indexers:
– container:
matchers:
– logs_path:
logs_path: ‘/var/log/containers’
resource_type: ‘container’
include_annotations: [‘DISABLE_STDOUT_LOG_COLLECT’] - rename:
fields:
– from: “kubernetes.pod.ip”
to: “containerIp”
– from: “host.name”
to: “nodeName”
– from: “kubernetes.pod.name”
to: “podName”
ignore_missing: true
fail_on_error: true
- /var/log/containers/slb-nginx-*.log
- type: log
paths:- “/var/lib/kubelet/pods//volumes/kubernetes.io~empty-dir/nginx-logs/access.log”
fields:
nodeIp: ${node_ip}
kafkaTopic: ‘nginx-access-log-filebeat’
topic: ‘slb-nginx-filebeat’
fields_under_root: true
- “/var/lib/kubelet/pods//volumes/kubernetes.io~empty-dir/nginx-logs/access.log”
processors:
- drop_fields:
fields: [“ecs”, “agent”, “input”, “host”, “kubernetes”, “log”]
output.kafka:
hosts: [“kafka-svc.kafka.svc.cluster.local:9092”]
topic: ‘%{[kafkaTopic]}’
required_acks: 1
compression: gzip
max_message_bytes: 1000000
filebeat.config:
inputs:
enabled: true
# cat filebeat-ds.yaml
apiVersion: v1
kind: ServiceAccount
metadata:
name: filebeat
namespace: kube-system
apiVersion: rbac.authorization.k8s.io/v1beta1
kind: ClusterRoleBinding
metadata:
name: filebeat
subjects:
- kind: ServiceAccount
name: filebeat
namespace: kube-system
roleRef:
kind: ClusterRole
name: cluster-admin
apiGroup: rbac.authorization.k8s.io
apiVersion: apps/v1
kind: DaemonSet
metadata:
generation: 1
labels:
k8s-app: slb-nginx-filebeat
name: slb-nginx-filebeat
namespace: kube-system
spec:
revisionHistoryLimit: 10
selector:
matchLabels:
k8s-app: slb-nginx-filebeat
template:
metadata:
labels:
k8s-app: slb-nginx-filebeat
spec:
nodeSelector:
app: slb-nginx-guangzhou
serviceAccount: filebeat
serviceAccountName: filebeat
containers:
– args:
– -c
– /etc/filebeat/filebeat.yml
– -e
env:
– name: node_name
valueFrom:
fieldRef:
apiVersion: v1
fieldPath: spec.nodeName
– name: node_ip
valueFrom:
fieldRef:
apiVersion: v1
fieldPath: status.hostIP
image: www.test.com/library/filebeat:7.6.1
imagePullPolicy: IfNotPresent
name: slb-nginx-filebeat
resources:
limits:
memory: 200Mi
requests:
cpu: 100m
memory: 100Mi
securityContext:
procMount: Default
runAsUser: 0
terminationMessagePath: /dev/termination-log
terminationMessagePolicy: File
volumeMounts:
– mountPath: /etc/filebeat
name: filebeat-config
readOnly: true
– mountPath: /var/lib/kubelet/pods
name: kubeletpods
readOnly: true
– mountPath: /var/log/containers
name: containerslogs
readOnly: true
– mountPath: /var/log/pods
name: pods-logs
readOnly: true
– mountPath: /var/lib/docker/containers
name: docker-logs
readOnly: true
dnsPolicy: ClusterFirstWithHostNet
hostNetwork: true
restartPolicy: Always
volumes:
– configMap:
defaultMode: 384
name: slb-nginx-filebeat-ds-config
name: filebeat-config
– hostPath:
path: /var/lib/kubelet/pods
type: “”
name: kubeletpods
– hostPath:
path: /var/log/containers
type: “”
name: containerslogs
– hostPath:
path: /var/log/pods
type: “”
name: pods-logs
– hostPath:
path: /var/lib/docker/containers
type: “”
name: docker-logs
updateStrategy:
rollingUpdate:
maxUnavailable: 1
type: RollingUpdate
2)查看日志:六、测试
测试逻辑功能和pod的健壮性。发布nginx的逻辑验证;修改nginx配置文件和执行nginx -t,nginx -s reload等功能;pod杀死后自动恢复;扩缩容功能等等。如下是发布流程的日志:
可以看到,Nginx发布时,会显示更新的配置文件,并做语法检测,然后判断内存大小是否要做内存回收,最后执行reload。如果更新的不是自己分组的配置文件则不会执行reload。总结:
最后,经过一个月的时间我们实现一层Nginx的容器化的迁移。实现了更加自动化和简便的Nginx的管理方式。同时,也更加熟悉对K8S的使用。在此分享记录,让大家对迁移传统应用到K8S等容器化平台做个参考。如果会开发,当然要拥抱Operator这样的好东西。声明:文中观点不代表本站立场。本文传送门:https://eyangzhen.com/235133.html