
论文
The structure, function and evolution of a complete human chromosome 8
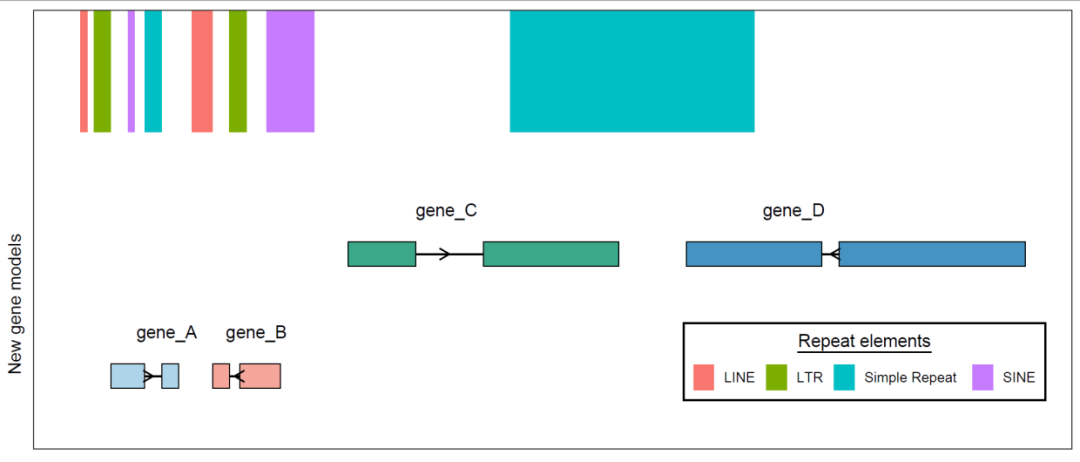
今天的推文我们模仿一下论文中figure1c最下面的小图
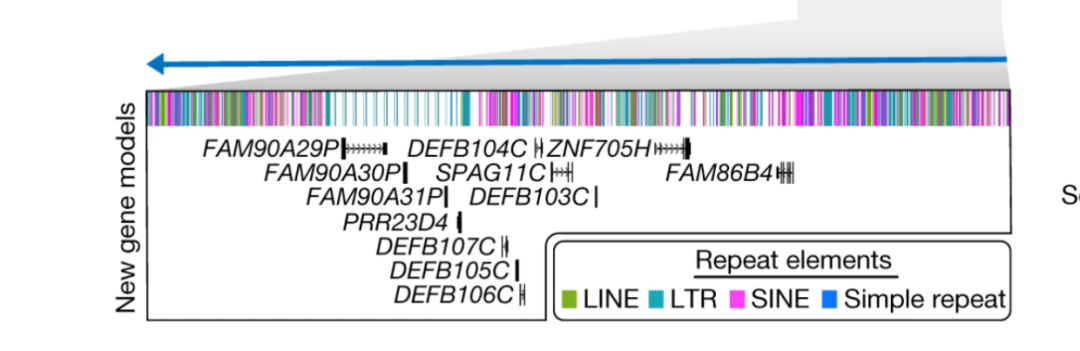

我理解的这个图是给定一个区间,有区间内的转座子坐标,还有区间内的基因坐标,然后放到同一个图上展示,最上方一排是一些转座子,下面就是基因
画基因结构我们用ggtranscript这个R包,因为是ggplot2的扩展,所以叠加内容就相对容易了,最上方的转座子位置用geom_rect()函数来添加
安装ggtranscript
github主页 https://github.com/dzhang32/ggtranscript
devtools::install_github("dzhang32/ggtranscript")准备基因的数据
这个是外显子的位置坐标
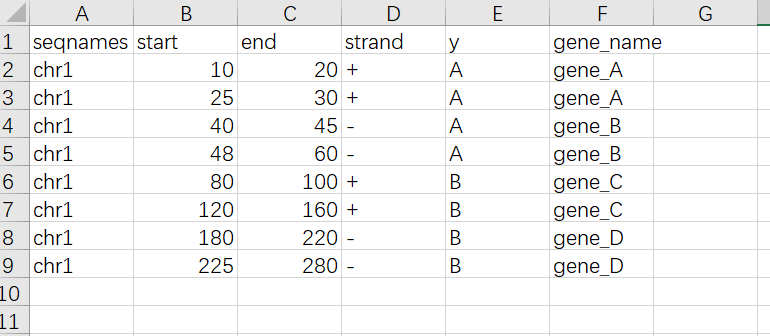
第一列是染色体号,第二三列是基因的起始位置,第四列是方向,第五列y是基因的放置位置,比如先把两个基因放到同一行,这个字符就是一样的,基因放到不同的行就写不同的字符,最后一列是基因的名字
这里有一个小知识点是excel里如果要把加减号当做普通字符输入需要在前面加一个单引号
转座子的数据
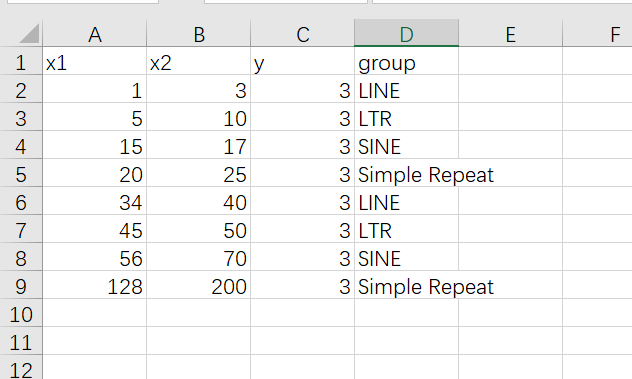
第一列和第二列是转座子的起始位置,第三列是y轴的位置,因为基因我是分为了两列,所以转座子的位置就给了3,如果基因有很多列,这个位置坐标也需要对应着改
加载需要用到的包
#devtools::install_github("dzhang32/ggtranscript")
library(ggtranscript)
library(ggplot2)
library(tidyverse)
library(readxl)
读取基因数据
df<-read_excel("D:/R_4_1_0_working_directory/env001/data/20230414/example.xlsx",
               sheet = "Sheet1")
df
生成基因名的位置坐标
df %>%
  group_by(gene_name,y) %>%
  summarise(min_value=min(start)) ->df.text
ggtranscript这个包里有一个函数是to_intron(),有了外显子的位置可以算内含子的位置
to_intron(df,group_var = "gene_name")读取转座子的位置坐标
df.segment<-read_excel("D:/R_4_1_0_working_directory/env001/data/20230414/example.xlsx",
                       sheet = "Sheet2")
作图代码
ggplot()+
  geom_range(data=df,aes(xstart=start,xend=end,y=y,fill=gene_name),
             height=0.2,
             show.legend = FALSE)+
  scale_fill_manual(values = c("#aed4e9","#f4a69a","#3ba889","#4593c3"))+
  geom_intron(data=to_intron(df,group_var = "gene_name"),
              aes(xstart=start,
                  xend=end,
                  y=y,
                  strand=strand))+
  ggnewscale::new_scale_fill()+
  geom_text(data=df.text,aes(x=min_value,y=y,label=gene_name),angle=90,vjust=-1)+
  geom_rect(data=df.segment,aes(xmin=x1,xmax=x2,ymin=y,ymax=y+1,fill=group))+
  theme_bw()+
  theme(axis.text = element_blank(),
        axis.ticks = element_blank(),
        panel.grid = element_blank())+
  labs(x=NULL,y="New gene models")+
  theme(legend.position = c(0.8,0.2),
        legend.background = element_rect(color="black"),
        legend.direction = "horizontal",
        legend.key.width = unit(5,'mm'),
        axis.title.y = element_text(hjust = 0.25))+
  scale_fill_discrete(name=expression(underline("Repeat elements")))+
  guides(fill=guide_legend(title.position = "top",
                           title.hjust = 0.5))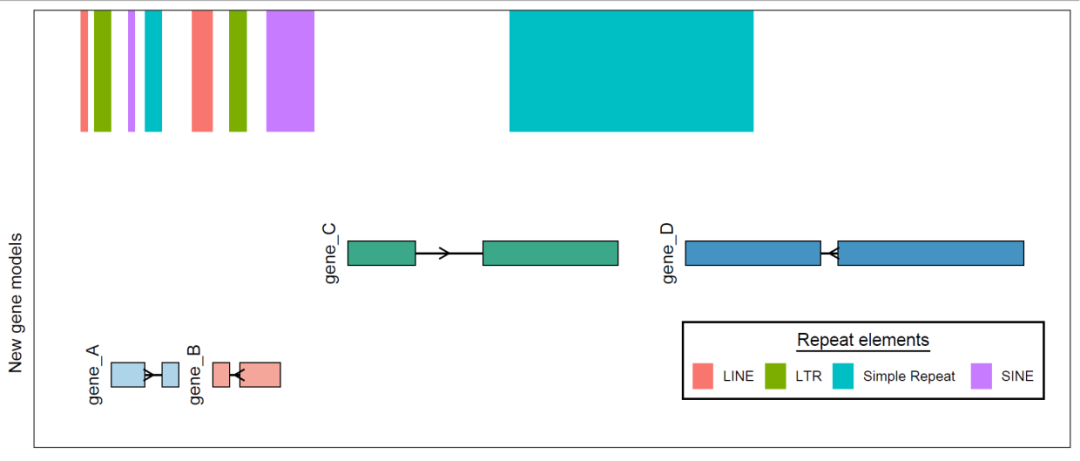
基因名这样放如果不好看,可以放到基因的上方
df %>%
  group_by(gene_name,y) %>%
  summarise(min_value=mean(start)) -> df.text01


ggplot()+
  geom_range(data=df,aes(xstart=start,xend=end,y=y,fill=gene_name),
             height=0.2,
             show.legend = FALSE)+
  scale_fill_manual(values = c("#aed4e9","#f4a69a","#3ba889","#4593c3"))+
  geom_intron(data=to_intron(df,group_var = "gene_name"),
              aes(xstart=start,
                  xend=end,
                  y=y,
                  strand=strand))+
  ggnewscale::new_scale_fill()+
  geom_text(data=df.text01,aes(x=min_value,y=y,label=gene_name),vjust=-3,hjust=0)+
  geom_rect(data=df.segment,aes(xmin=x1,xmax=x2,ymin=y,ymax=y+1,fill=group))+
  theme_bw()+
  theme(axis.text = element_blank(),
        axis.ticks = element_blank(),
        panel.grid = element_blank())+
  labs(x=NULL,y="New gene models")+
  theme(legend.position = c(0.8,0.2),
        legend.background = element_rect(color="black"),
        legend.direction = "horizontal",
        legend.key.width = unit(5,'mm'),
        axis.title.y = element_text(hjust = 0.25))+
  scale_fill_discrete(name=expression(underline("Repeat elements")))+
  guides(fill=guide_legend(title.position = "top",
                           title.hjust = 0.5))
有的基因名的位置不是太合适,如何用代码调整到合适的位置暂时想不到了,出图后手动调整吧
示例数据和代码可以给推文点赞,然后点击在看,最后留言获取
声明:文中观点不代表本站立场。本文传送门:https://eyangzhen.com/59100.html
