
1引言
接着上一次 ChIP-seq 绘图设计, 我们设计了一个布局,说要往里面填充图形, 考虑到每个图形间可能需要一点的间距, 其实我已经写好了,但是间距这个东西不太好调,于是考虑使用了 gtable 来重新写布局,相应的代码也要重新改一下,不过大概意思差不多。gtable 这个包可以很好的对布局进行操作,插入,删除,添加间距等等,还是很不错的。相关函数已经上传到 ggChIPvis github 上了。
我们使用 HeatmapLayout 函数可以设置每个 panel 的大小, 我们最后使用 ChipHeatmap 来绘制单个图形:
HeatmapLayout <- function(mat = NULL,
                          heatmap.size = c(0.7,0.5),
                          heatmap.xaxis.h = 0.1,
                          heatmap.blegend.h = 0.035,
                          heatmap.rlegend.w = 0.035,
                          heatmap.profile.h = 0.2,
                          heatmap.label.h = 0.075,
                          heatmap.lanno.w = 0.05,
                          heatmap.lanno.label.w = 0.1,
                          draw.profile = TRUE,
                          legend.pos = c("right","bottom"),
                          plot.size = c(1,1),
                          newpage = TRUE){
  legend.pos <- match.arg(legend.pos,c("right","bottom"))

  # ============================================================================
  # design heatmap
  # ============================================================================
  ...
  # ============================================================================
  # layout
  # ============================================================================
  main.p <- gtable(widths = unit(c(heatmap.lanno.label.w,heatmap.lanno.w,
                                   heatmap.size[1],heatmap.rlegend.w),"npc"),
                   heights = unit(c(heatmap.label.h,heatmap.profile.h,
                                    heatmap.size[2],
                                    heatmap.xaxis.h,heatmap.blegend.h),"npc"),
                   name = "main",
                   vp = viewport(width = plot.size[1],height = plot.size[2]))


  # gtable_show_layout(main.p)

 return(main.p)
}
具体的使用见文档:
2安装
# install.packages("devtools")
devtools::install_github("junjunlab/ggChIPvis")

# or
remotes::install_github("junjunlab/ggChIPvis")
library(ggChIPvis)
3ChipHeatmap
加载一下数据(EnrichedHeatmap::normalizeToMatrix, ChIPseeker::getTagMatrix 和 deeptools 的 computeMatrix 输出结果都行), 这里拿了 deeptools 软件的输出结果测试:
library(ggChIPvis)
library(grid)
library(gtable)

# parse deeptools output
deep_mat <- parseDeeptools(deeptools_output = "refPoint-data.gz")

row_split <- rep(c("group 1","group 2","group 3"),c(500,1500,3000))
默认绘图:
grid.newpage()
pushViewport(viewport(x = 0.5,y = 0.5,width = 0.5,height = 0.85))
ChipHeatmap(norm.mat = deep_mat[[1]])
popViewport()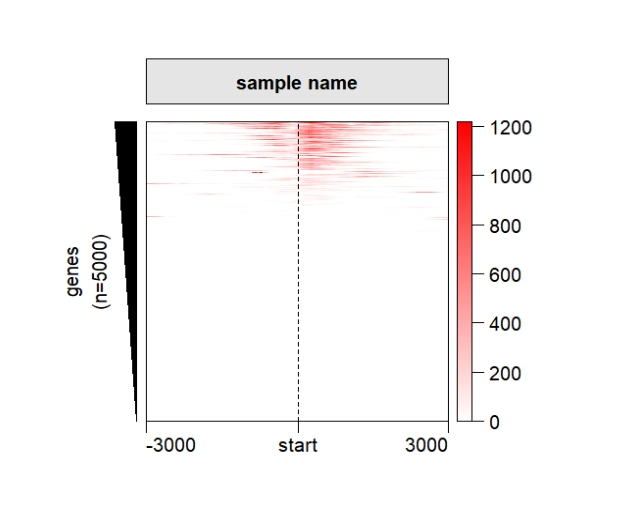

可以改变 panel 之间的距离,它们就连在一起了:
grid.newpage()
pushViewport(viewport(x = 0.5,y = 0.5,width = 0.5,height = 0.85))
ChipHeatmap(norm.mat = deep_mat[[1]],
            panel.col.space = 0,panel.row.space = 0)
popViewport()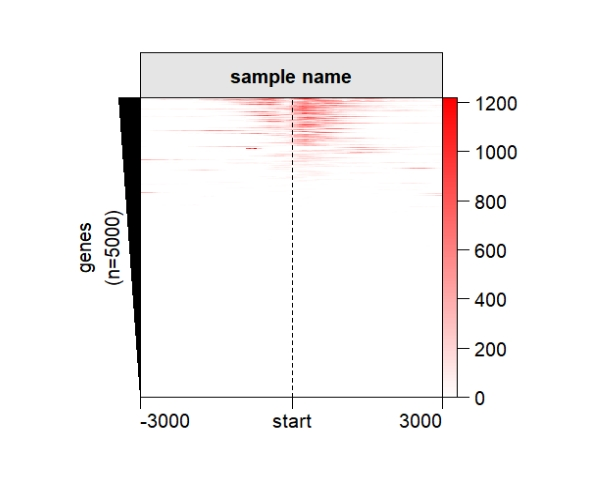
侧面注释换成矩形也可以:
grid.newpage()
pushViewport(viewport(x = 0.5,y = 0.5,width = 0.5,height = 0.85))
ChipHeatmap(norm.mat = deep_mat[[1]],draw.anno.left.shape = "rect")
popViewport()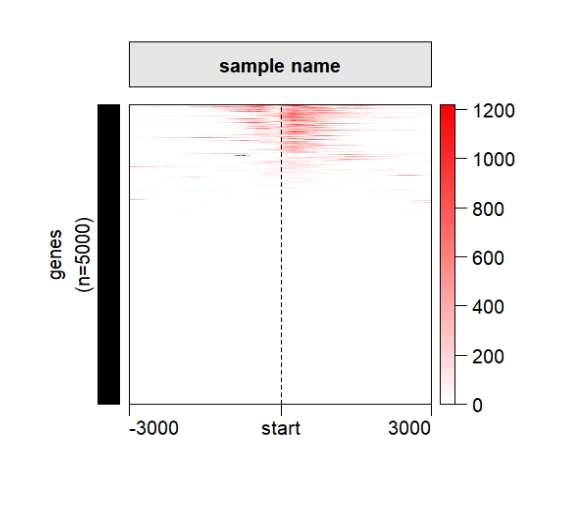
图例放在下面:
grid.newpage()
pushViewport(viewport(x = 0.5,y = 0.5,width = 0.5,height = 0.85))
ChipHeatmap(norm.mat = deep_mat[[1]],
            quantile.threshold = 0.99,
            legend.pos = "bottom")
popViewport()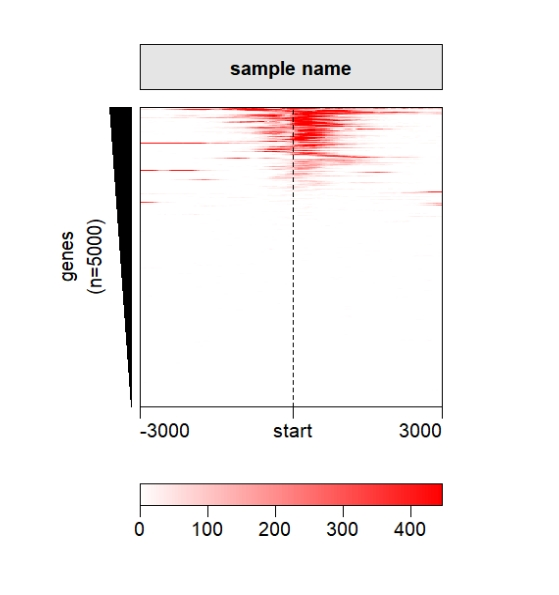
添加 profile:
grid.newpage()
pushViewport(viewport(x = 0.5,y = 0.5,width = 0.5,height = 0.85))
ChipHeatmap(norm.mat = deep_mat[[1]],draw.profile = T)
popViewport()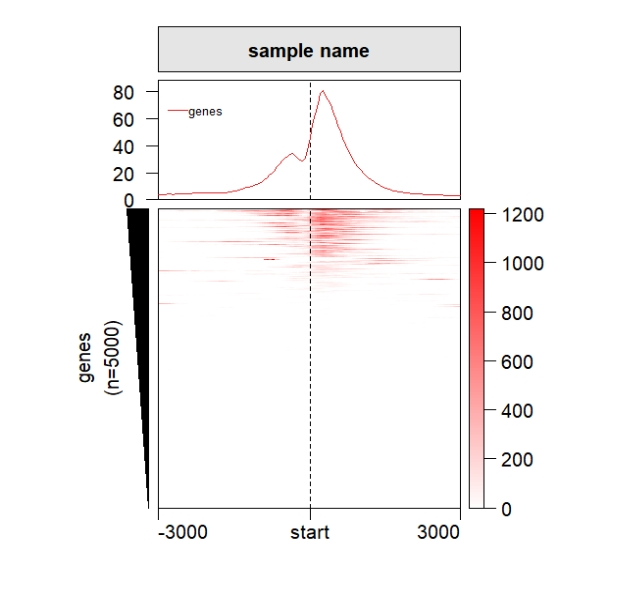
行的分类:
grid.newpage()
pushViewport(viewport(x = 0.5,y = 0.5,width = 0.5,height = 0.85))
ChipHeatmap(norm.mat = deep_mat[[1]],draw.profile = T,
            row.split = row_split)
popViewport()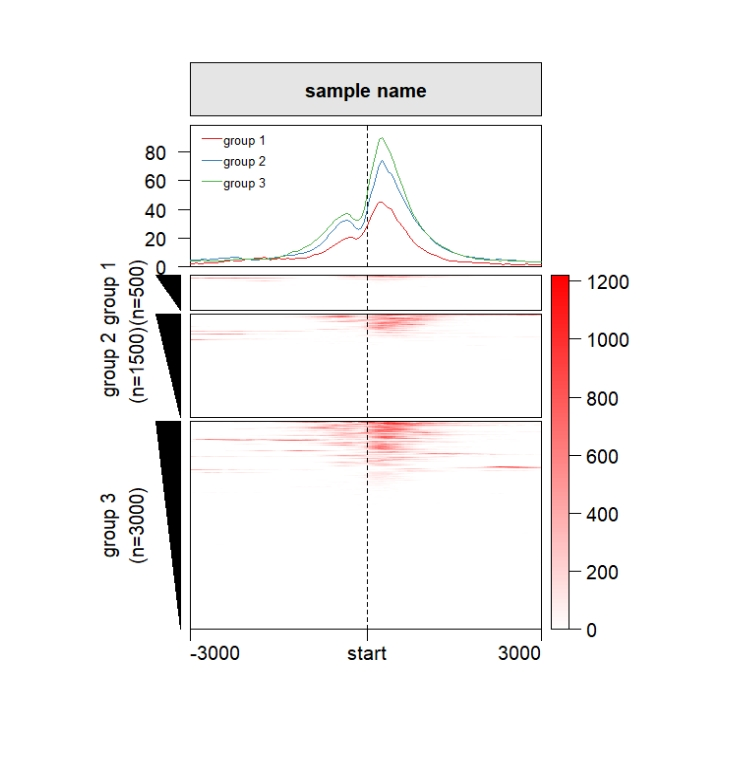
修改颜色,聚类 panel 之间的间距:
grid.newpage()
pushViewport(viewport(x = 0.5,y = 0.5,width = 0.5,height = 0.85))
ChipHeatmap(norm.mat = deep_mat[[1]],
            row.split = row_split,
            keep.cluster.panel.same = T,
            draw.profile = T,
            draw.anno.left.shape = "rect",
            anno.left.col = RColorBrewer::brewer.pal(3,"Set3"),
            profile.line.col = RColorBrewer::brewer.pal(3,"Set3"),
            cluster.gap = 0.05)
popViewport()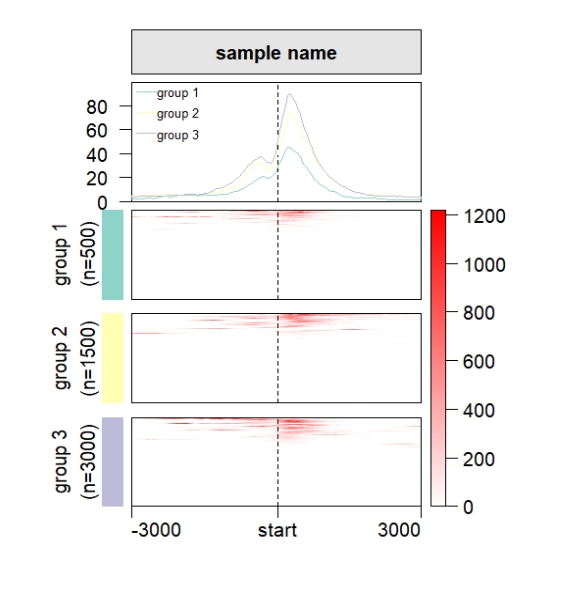
4multiHeatmap
multiHeatmap 可以将多个图形组合起来。
绘图:
col2 <- RColorBrewer::brewer.pal(4,"Set1")
col <- list(c("white",col2[1]),c("white",col2[2]),
            c("white",col2[3]),c("white",col2[4]))

multiHeatmap(mat.list = deep_mat,
             sample.label = c("0 h","2 h","8 h","24 h"))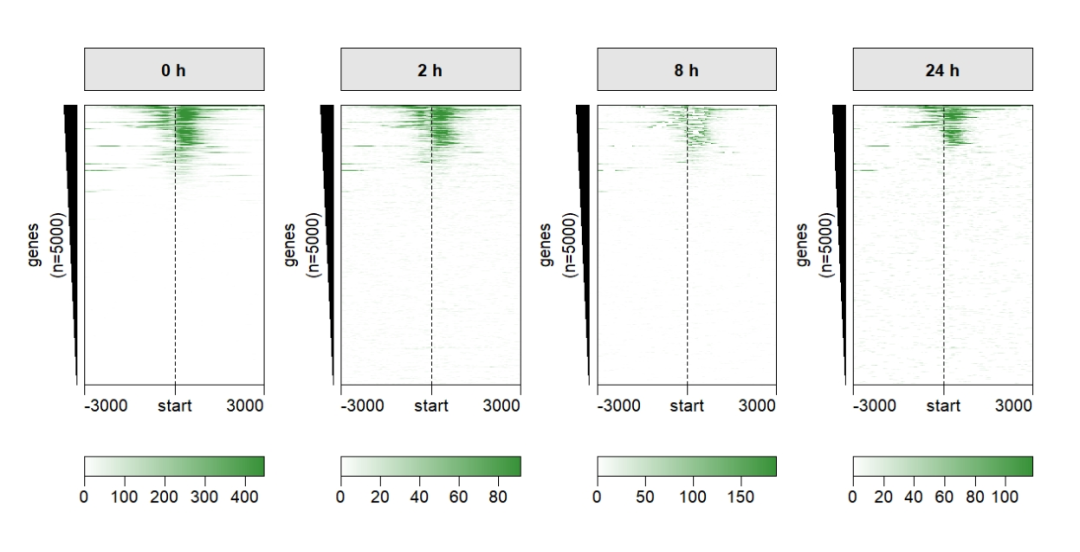
修改颜色:
multiHeatmap(mat.list = deep_mat,
             sample.label = c("0 h","2 h","8 h","24 h"),
             heatmap.col = col)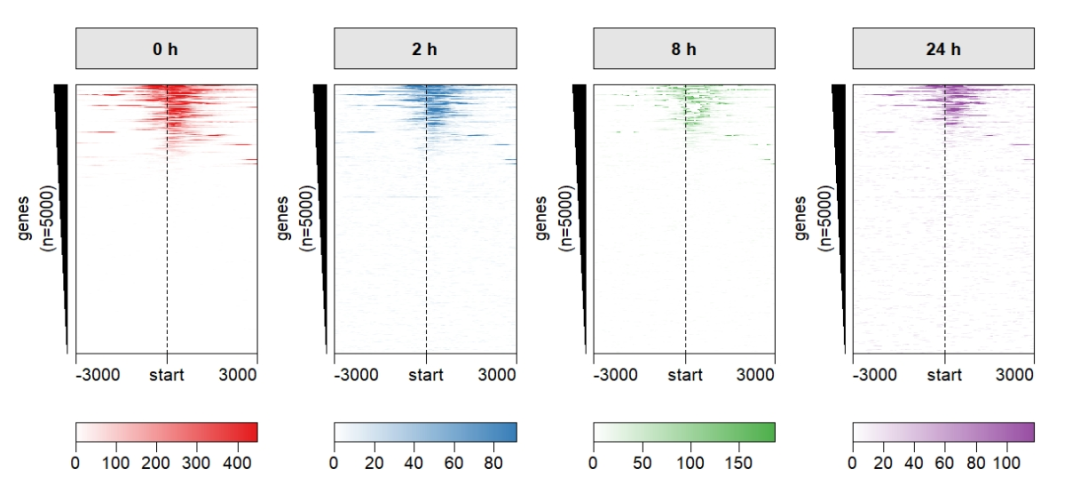
保留一个图例,这样你可以看出不同组之间的变化了:
multiHeatmap(mat.list = deep_mat,
             sample.label = c("0 h","2 h","8 h","24 h"),
             keep.one.left.annobar = T,
             ChipHeatmap.params = list(HeatmapLayout.params = list(heatmap.size = c(0.9,0.5))),
             scale.range = T,
             keep.one.legend = T)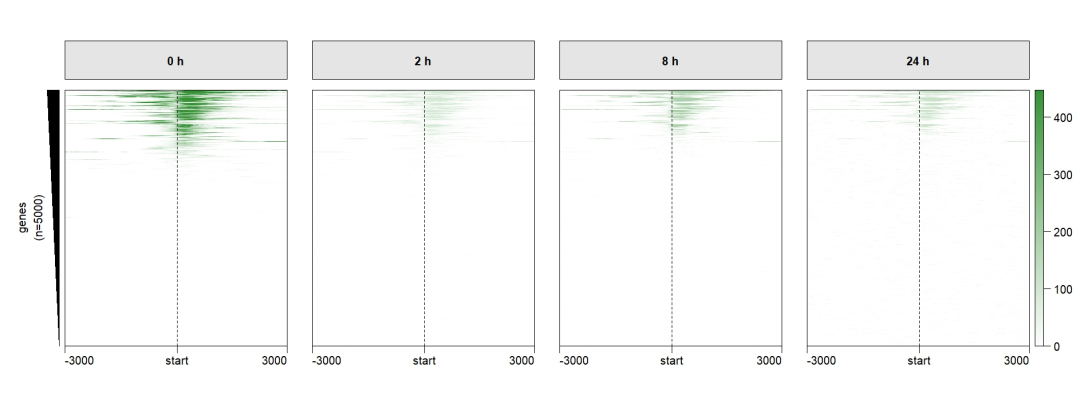
行切割:
multiHeatmap(mat.list = deep_mat,
             sample.label = c("0 h","2 h","8 h","24 h"),
             heatmap.col = col,
             row.split = row_split)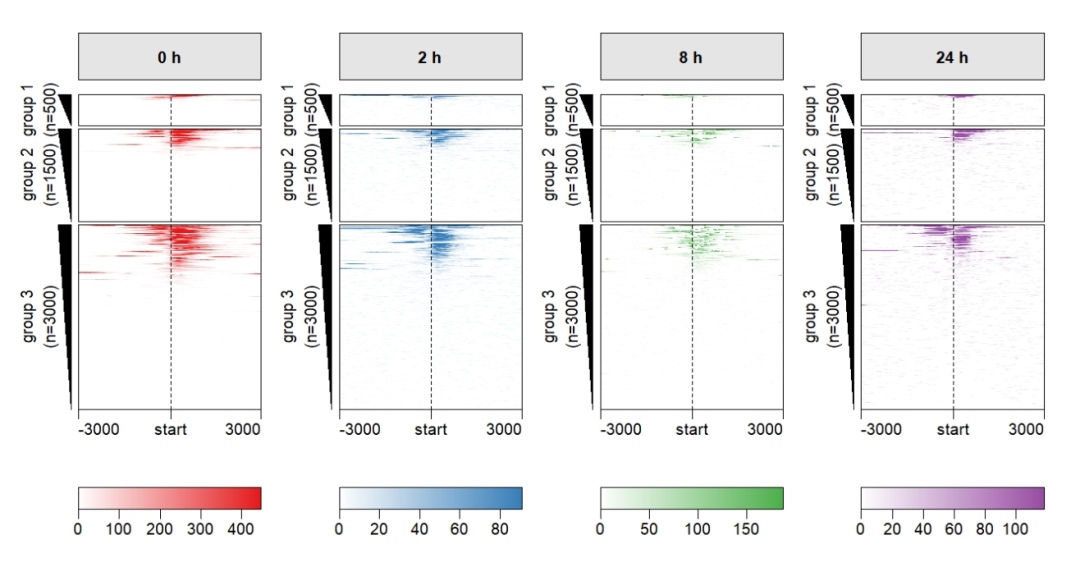
添加 profile:
multiHeatmap(mat.list = deep_mat,
             sample.label = c("0 h","2 h","8 h","24 h"),
             draw.profile = T,
             scale.y.range = T,
             ChipHeatmap.params = list(HeatmapLayout.params = list(heatmap.size = c(1,0.5))),
             plot.size = c(0.8,0.8),
             scale.range = T,
             keep.one.left.annobar = T,
             keep.one.legend = T,
             keep.one.line.legend = T,
             keep.one.profile.yaxis = T,
             row.split = row_split)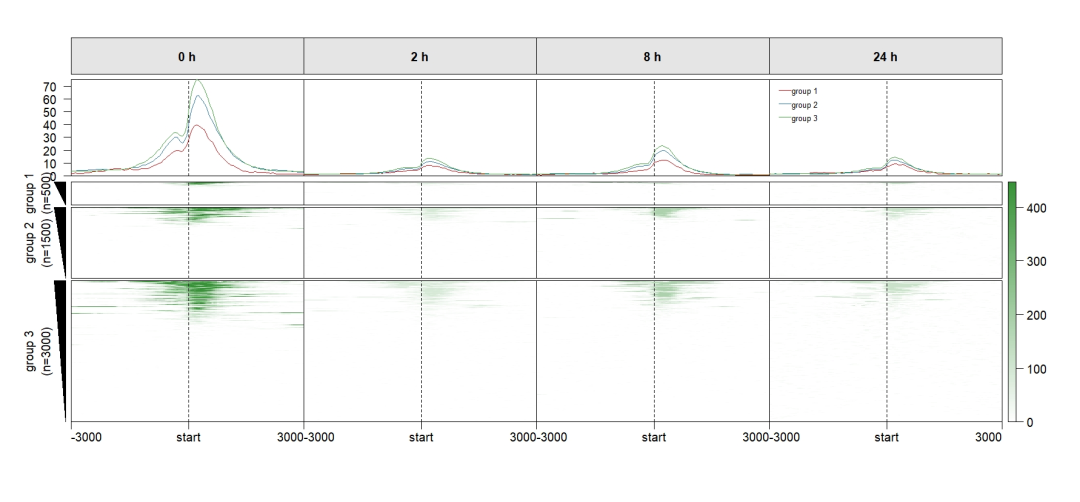
你还可以添加分组注释:
multiHeatmap(mat.list = deep_mat,
             sample.label = c("0 h","2 h","8 h","24 h"),
             sample.group1 = list(group1 = c("0 h","2 h"),
                                  group2 = c("8 h","24 h")))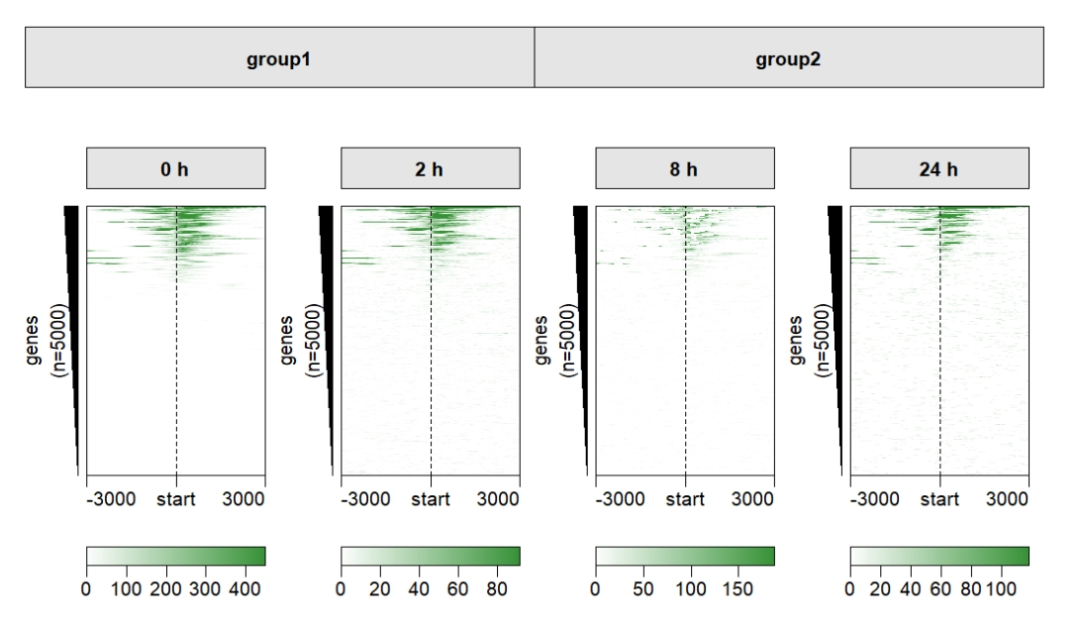
设置颜色:
multiHeatmap(mat.list = deep_mat,
             sample.label = c("0 h","2 h","8 h","24 h"),
             sample.group1 = list(group1 = c("0 h","2 h"),
                                  group2 = c("8 h","24 h")),
             sample.group2 = list(control = c("0 h","2 h","8h"),
                                  treat = c("24 h")),
             draw.anno.fun.params.g1 = list(group.anno.rect.fill = c("orange","pink")),
             draw.anno.fun.params.g2 = list(group.anno.rect.fill = c("purple","grey")),
             panel.rect.gp = gpar(fill = "grey90"),
             anno.panel.height = 0.05)
换成线:
multiHeatmap(mat.list = deep_mat,
             sample.label = c("0 h","2 h","8 h","24 h"),
             sample.group1 = list(group1 = c("0 h","2 h"),
                                  group2 = c("8 h","24 h")),
             sample.group2 = list(control = c("0 h","2 h","8h"),
                                  treat = c("24 h")),
             draw.anno.fun.params.g1 = list(sample.anno.type = "line"),
             draw.anno.fun.params.g2 = list(sample.anno.type = "line"))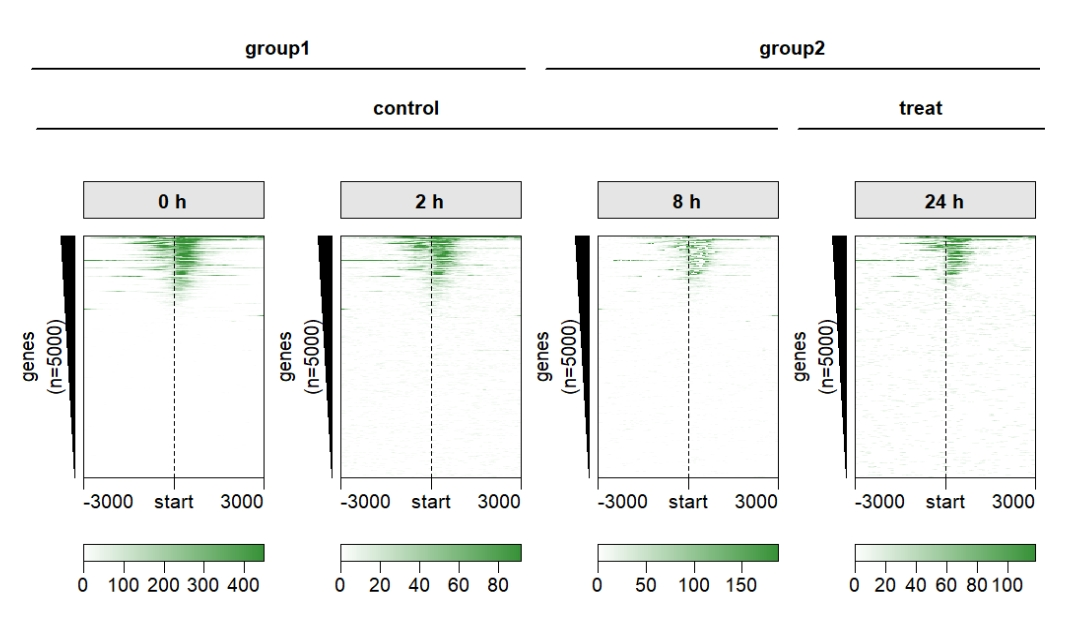
5结尾
路漫漫其修远兮,吾将上下而求索。
欢迎加入生信交流群。加我微信我也拉你进 微信群聊 老俊俊生信交流群 (微信交流群需收取 20 元入群费用,一旦交费,拒不退还!(防止骗子和便于管理)) 。QQ 群可免费加入, 记得进群按格式修改备注哦。
声明:文中观点不代表本站立场。本文传送门:https://eyangzhen.com/359184.html


