
论文
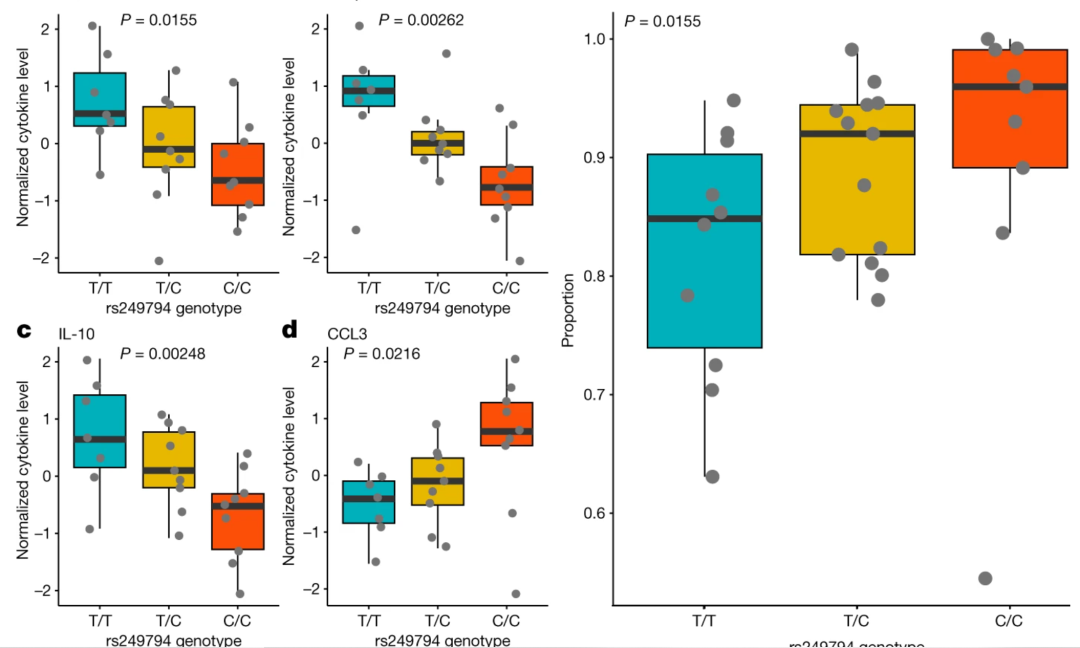
Evolution of immune genes is associated with the Black Death
论文中Figure4的代码和数据是可以找到的,今天的推文来复现一下论文中的Figure4

论文中提供的数据和代码的链接 https://github.com/TaurVil/VilgalysKlunk_yersinia_pestis/
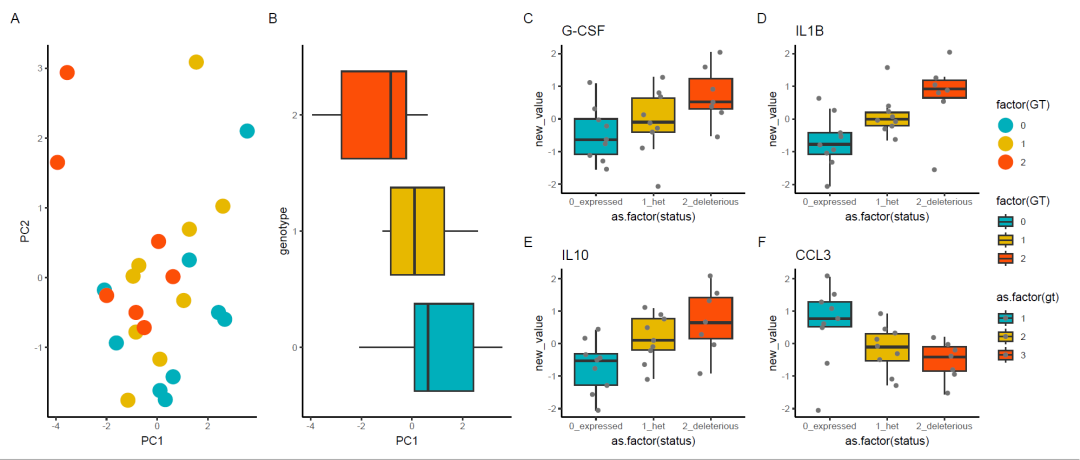
推文主要的学习点是patchwork包将ggplot2的多个图组合到一起
论文中具体的数据是什么意思暂时看的不是很明白,所以跳过论文中处理数据的代码,直接用处理好的数据来画图
加载需要用到的R包
library(tidyverse)
library(patchwork)
一个散点图
dat01<-read_delim("data/20231101/dat01.txt",
                  delim = "t")
dat01
p2 <- ggplot(dat01[dat01$TIME == "24h",], aes(x=PC1, y=PC2, color = factor(GT))) +
  geom_point(size=6) +
  theme_classic() +
  scale_color_manual(values = c("#00AFBB", "#E7B800", "#FC4E07"))
p2
一个箱线图
p1 <- ggplot(dat01, aes(x=factor(GT), y=PC1, fill=factor(GT))) +
  geom_boxplot() + coord_flip() +
  theme_classic() +
  scale_color_manual(values = c("#00AFBB", "#E7B800", "#FC4E07")) +
  scale_fill_manual(values = c("#00AFBB", "#E7B800", "#FC4E07")) +
  xlab("genotype")

p1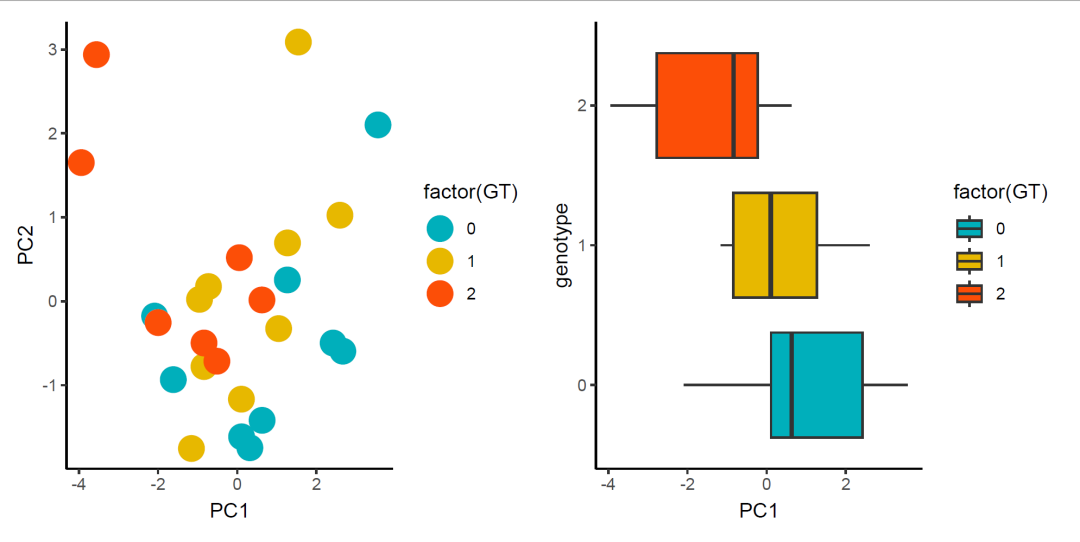
四个箱线图
dat02<-read_delim("data/20231101/dat02.txt",
                  delim = "t")
dat02

p3<-dat02 %>%
  filter(cytokine == "G-CSF") %>%
  mutate(new_value=qqnorm(value, plot.it = F)$x) %>%
  ggplot(aes(y=new_value, x=as.factor(status), fill=as.factor(gt))) +
  geom_boxplot(outlier.shape = NA) +
  ggtitle("G-CSF") +
  geom_jitter(width=0.2,col='gray45') +
  theme_classic() +
  scale_fill_manual(values = c("#00AFBB", "#E7B800", "#FC4E07"))

p3


p4<-dat02 %>%
  filter(cytokine == "IL1B") %>%
  mutate(new_value=qqnorm(value, plot.it = F)$x) %>%
  ggplot(aes(y=new_value, x=as.factor(status), fill=as.factor(gt))) +
  geom_boxplot(outlier.shape = NA) +
  ggtitle("IL1B") +
  geom_jitter(width=0.2,col='gray45') +
  theme_classic() +
  scale_fill_manual(values = c("#00AFBB", "#E7B800", "#FC4E07"))
p4


p5<-dat02 %>%
  filter(cytokine == "IL10") %>%
  mutate(new_value=qqnorm(value, plot.it = F)$x) %>%
  ggplot(aes(y=new_value, x=as.factor(status), fill=as.factor(gt))) +
  geom_boxplot(outlier.shape = NA) +
  ggtitle("IL10") +
  geom_jitter(width=0.2,col='gray45') +
  theme_classic() +
  scale_fill_manual(values = c("#00AFBB", "#E7B800", "#FC4E07"))
p5

p6<-dat02 %>%
  filter(cytokine == "CCL3") %>%
  mutate(new_value=qqnorm(value, plot.it = F)$x) %>%
  ggplot(aes(y=new_value, x=as.factor(status), fill=as.factor(gt))) +
  geom_boxplot(outlier.shape = NA) +
  ggtitle("CCL3") +
  geom_jitter(width=0.2,col='gray45') +
  theme_classic() +
  scale_fill_manual(values = c("#00AFBB", "#E7B800", "#FC4E07"))
p6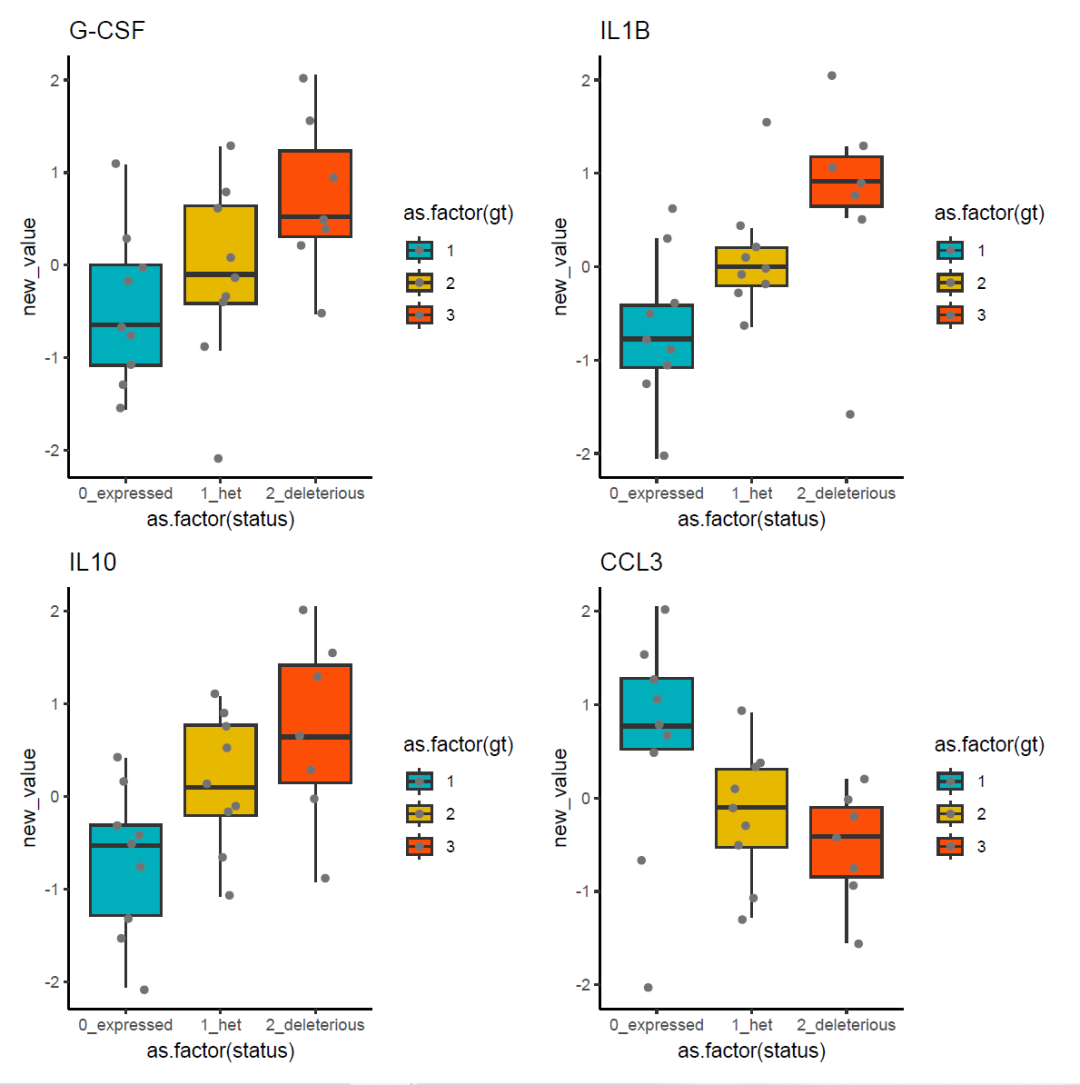
所有图组合到一起
( p2 / p1 ) + part2 + plot_annotation(tag_levels = 'A') +
  plot_layout(guides = 'collect', nrow = 1, ncol=3,
              widths = c(1,1,2))
示例数据和代码可以给推文打赏一元获取
声明:文中观点不代表本站立场。本文传送门:https://eyangzhen.com/373058.html


