
1引言
我们大部分看到的图片一般是水平或者竖直的,我们看看如何在 R 里面绘制弧形的图片。
我们读取图片以后会转化为一个颜色矩阵,也就是每个矩阵位置代表一个像素点,然后再把这些像素点作为颜色填充在弧形的矩形内就可以了。
2探索
读取图片:
library(jjAnno)
library(grid)

img1 <- system.file("extdata/animal-img/", "1.jpg", package = "jjAnno")

image <- magick::image_read(img1)
然后转化为颜色矩阵:
img.raster <- data.frame(as.matrix(as.raster(image)))

dim(img.raster)
# [1] 640 640

head(img.raster[1:3,1:3])
#          X1        X2        X3
# 1 #77a3bcff #78a4bdff #78a4bdff
# 2 #77a3bcff #78a4bdff #78a4bdff
# 3 #77a3bcff #78a4bdff #78a4bdff我们可以直接那这个画图:grid.newpage()
pushViewport(viewport(width = 0.5,height = 0.5))
grid.rect()
grid.raster(image = as.matrix(img.raster),width = 1,height = 1)
grid.xaxis()
grid.yaxis()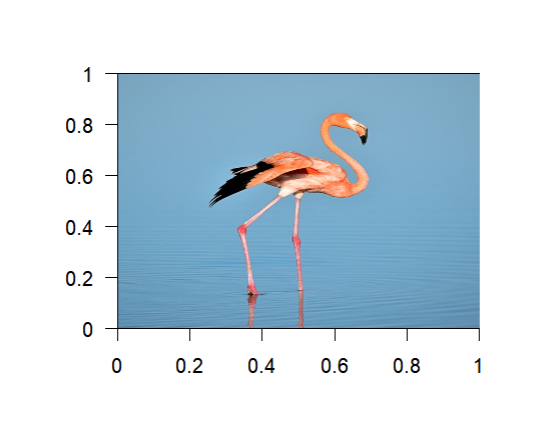

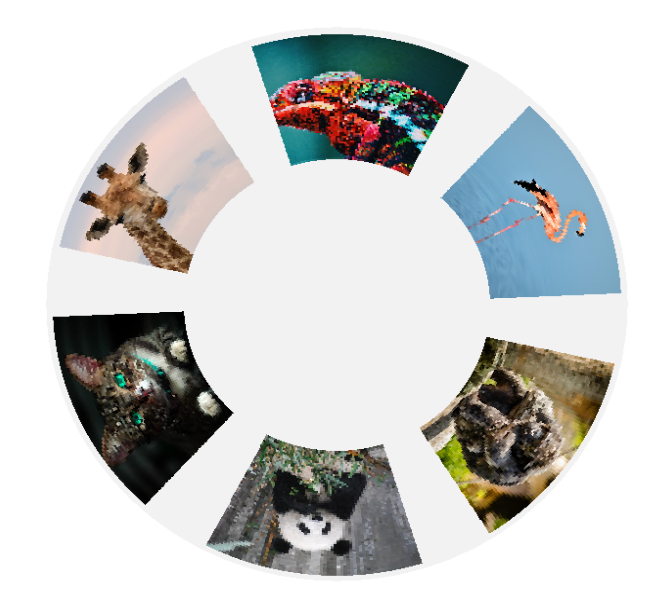
有了这些探索,我们可以借助 arcRectGrob 来绘制环形的图像,不过感觉运行很慢,按理说也就是不到 1000×1000 的矩阵而已,难道是 arcRectGrob 计算慢的问题?。
# func test
img1 <- system.file("extdata/animal-img/", "1.jpg", package = "jjAnno")
img2 <- system.file("extdata/animal-img/", "2.jpg", package = "jjAnno")
img3 <- system.file("extdata/animal-img/", "3.jpg", package = "jjAnno")
img4 <- system.file("extdata/animal-img/", "4.jpg", package = "jjAnno")
img5 <- system.file("extdata/animal-img/", "5.jpg", package = "jjAnno")
img6 <- system.file("extdata/animal-img/", "6.jpg", package = "jjAnno")

img.lst <- c(img1,img2,img3,img4,img5,img6)

start <- c(0,60,120,180,240,300)

newpage()
lapply(seq_along(img.lst), function(x){
  image <- magick::image_read(img.lst[x])

  grid.draw(arcRasterGrob(raster = image,
                          start = start[x],end = start[x] + 50,
                          r0 = 0.5,r1 = 1))
})
然后是相关代码:arcRasterGrob <- function(raster = NULL,
                          start = 0,end = 90,
                          r0 = 0.5,r1 = 1,
                          x0 = 0,y0 = 0,
                          border.col = NA,
                          scaling = 0.1,
                          extend.xscale = 0.05,
                          extend.yscale = 0.05,
                          clock.wise = FALSE,
                          ...,
                          name = NULL,
                          gp = NULL, vp = NULL){

  lst <- list(raster = raster,
              start = start,end = end,
              r0 = r0,r1 = r1,
              x0 = x0,y0 = y0,
              clock.wise = clock.wise,
              extend.xscale = extend.xscale,
              extend.yscale = extend.yscale,
              name = name, gp = gp, vp = vp,
              cl = "arcRasterGrob")

  do.call(gTree,lst)
}


makeContent.arcRasterGrob <- function(x){
  g <- .arcRasterGrob(raster = x$raster,
                      start = x$start,end = x$end,
                      r0 = x$r0,r1 = x$r1,
                      x0 = x$x0,y0 = x$y0,
                      clock.wise = x$clock.wise,
                      extend.xscale = x$extend.xscale,
                      extend.yscale = x$extend.yscale,
                      name = x$name, gp = x$gp, vp = x$vp)
  grid::setChildren(x, children = g$children)
}


.arcRasterGrob <- function(raster = NULL,
                           start = 0,end = 90,
                           r0 = 0.5,r1 = 1,
                           x0 = 0,y0 = 0,
                           border.col = NA,
                           scaling = 0.1,
                           extend.xscale = 0.05,
                           extend.yscale = 0.05,
                           clock.wise = FALSE,
                           name = NULL,
                           gp = NULL, vp = NULL,...){
  # extend scale
  extend.theta <- (end - start)*extend.xscale
  start_ed <- start + extend.theta
  end_ed <- end - extend.theta

  extend.radias <- (r1 - r0)*extend.yscale
  r0_ed <- r0 + extend.radias
  r1_ed <- r1 - extend.radias

  # load raster data
  img.raster <- data.frame(as.matrix(grDevices::as.raster(raster)))
  raster <- resize_image(img.raster,
                         w = ncol(img.raster)*scaling,
                         h = nrow(img.raster)*scaling)

  # rescale data range
  nr <- nrow(raster)
  nc <- ncol(raster)

  scale.y <- rev(scales::rescale(seq(0,nr,1),to = range(r0_ed,r1_ed)))
  y.min <- scale.y[1:(length(scale.y) - 1)]
  y.max <- scale.y[2:length(scale.y)]

  scale.x <- rev(scales::rescale(seq(0,nc,1),to = range(start_ed,end_ed)))
  x.min <- scale.x[1:(length(scale.x) - 1)]
  x.max <- scale.x[2:length(scale.x)]

  # ============================================================================
  # draw raster grobs
  rect.list <- gList()

  for (i in 1:nc) {
    rect.grob <- arcRectGrob(xmin = x.min[i],xmax = x.max[i],
                             ymin = y.min,ymax = y.max,
                             r0 = y.min,r1 = y.max,
                             x0 = x0,y0 = y0,
                             start = x.min[i],end = x.max[i],
                             clock.wise = clock.wise,
                             extend.xscale = 0,
                             extend.yscale = 0,
                             polygon.gp = gpar(fill = raster[,i],col = border.col))

    rect.list <- gList(rect.list,rect.grob)
  }

  # ============================================================================
  # combine grobs
  # ============================================================================
  grid::gTree(children = grid::gList(rect.list),
              name = "arcRasterGrob")
}

# note: from circlize package
resize_image = function(m, w, h = round(w*(ncol(m)/nrow(m)))) {

  w0 = nrow(m)
  h0 = ncol(m)

  w_ratio = w0/w
  h_ratio = h0/h

  # Do resizing -- select appropriate indices
  if(length(dim(m)) == 2) {
    out = m[ ceiling(w_ratio* 1:w), ceiling(h_ratio* 1:h)]
  } else {
    out = m[ ceiling(w_ratio* 1:w), ceiling(h_ratio* 1:h), , drop = FALSE]
  }
  return(out)
}
arcRectGrob 的代码:
.arcRectGrob <- function(xmin = NULL,xmax = NULL,
                         ymin = NULL,ymax = NULL,
                         start = 0,end = 360,
                         r0 = 0.5,r1 = 1,
                         x0 = 0,y0 = 0,
                         polygon.gp = NULL,
                         n = 100,clock.wise = FALSE,
                         extend.xscale = 0.05,
                         extend.yscale = 0.05,
                         xscale = NULL,
                         yscale = NULL,
                         ...,
                         name = NULL,
                         gp = NULL, vp = NULL){
  # check length
  if(length(ymin) == 1 & length(ymax) == 1){
    ymin <- rep(ymin,length(xmin))
    ymax <- rep(ymax,length(xmax))
  }

  if(length(xmin) == 1 & length(xmax) == 1){
    xmin <- rep(xmin,length(ymin))
    xmax <- rep(xmax,length(ymax))
  }

  # extend scale
  extend.theta <- (end - start)*extend.xscale
  start_ed <- start + extend.theta
  end_ed <- end - extend.theta

  extend.radias <- (r1 - r0)*extend.yscale
  r0_ed <- r0 + extend.radias
  r1_ed <- r1 - extend.radias

  # =============================
  # check sector x,y scale
  if(is.null(yscale)){
    r.scale <- range(c(ymin,ymax))
  }else{
    r.scale <- yscale
  }

  if(is.null(xscale)){
    thata.scale <- range(c(xmin,xmax))
  }else{
    thata.scale <- xscale
  }
  # =============================

  # rescale data range
  scale.y <- scales::rescale(c(ymin,ymax),to = range(r0_ed,r1_ed),from = r.scale)
  rect.r0 <- scale.y[1:length(ymin)]
  rect.r1 <- scale.y[(length(ymin) + 1):length(scale.y)]

  # check direction
  if(clock.wise == TRUE){
    scale.x <- scales::rescale(c(xmin,xmax),to = 2*pi - range(as.radian(start_ed),as.radian(end_ed)),
                               from = thata.scale)
  }else{
    scale.x <- scales::rescale(c(xmin,xmax),to = range(as.radian(start_ed),as.radian(end_ed)),
                               from = thata.scale)
  }

  rect.start <- scale.x[1:length(xmin)]
  rect.end <- scale.x[(length(xmin) + 1):length(scale.x)]

  if(clock.wise == TRUE){
    new.start <- rect.start
    new.end <- rect.end
  }else{
    new.start <- as.radian(end) - (rect.start - as.radian(start))
    new.end <- new.start - (rect.end - rect.start)
  }

  # loop create coordinates
  lapply(seq_along(rect.r0), function(x){
    theta <- seq(new.start[x], new.end[x], length = n)

    # ==============================================
    # inner
    # ==============================================
    rin <- rect.r0[x]
    if(rin == 0){
      xp0 = x0;yp0 = y0
    }else{
      xp0 <- x0 + rin*cos(theta)
      yp0 <- y0 + rin*sin(theta)
    }

    # ==============================================
    # outer
    # ==============================================
    rout <- rect.r1[x]
    xp1 <- x0 + rout*cos(theta)
    yp1 <- y0 + rout*sin(theta)

    rect.df <- data.frame(x = c(xp0,rev(xp1)),y = c(yp0,rev(yp1)),
                          id = x,
                          group = rep(c("inner","outer"),c(length(xp0),length(xp1))))

    return(rect.df)
  }) %>% do.call("rbind",.) -> all.df

  # grobs
  polygon.grob <- polygonGrob(x = all.df$x,y = all.df$y,
                              id = all.df$id,
                              gp = polygon.gp,
                              default.units = "native",
                              name = "polygon")
  # ============================================================================
  # combine grobs
  # ============================================================================
  grid::gTree(children = grid::gList(polygon.grob),
              name = "arcRectGrob")
}
3结尾
路漫漫其修远兮,吾将上下而求索。
欢迎加入生信交流群。加我微信我也拉你进 微信群聊 老俊俊生信交流群 (微信交流群需收取 20 元入群费用,一旦交费,拒不退还!(防止骗子和便于管理)) 。QQ 群可免费加入, 记得进群按格式修改备注哦。
声明:文中观点不代表本站立场。本文传送门:https://eyangzhen.com/373428.html


