
1引言
在 circlize 参考文档中,作者有一部分介绍了 nested zooming 的部分,主要来放大展示一些区域的具体图形,在数据量多,图形拥挤的时候使用非常有效,用来突出重要区域的部分,下面是示例图形:
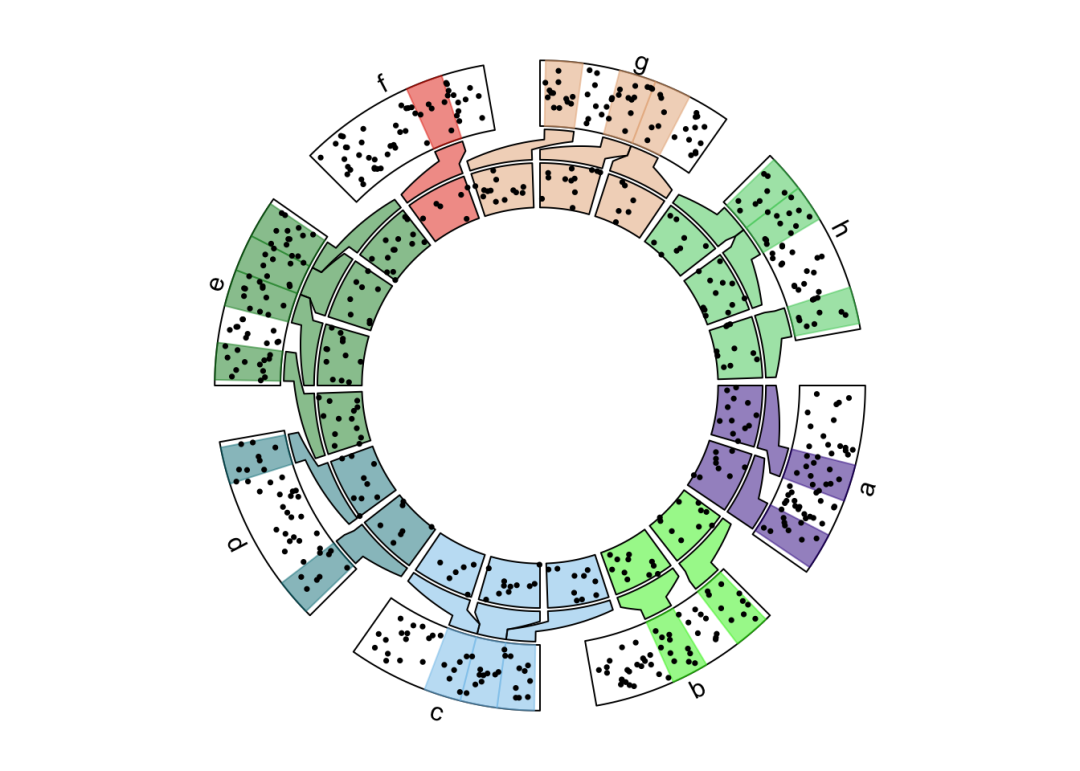

仔细观察图形可以看到由两层 track 组成, 放大的区域扇区的大小不会相互重叠,里面应该是有一些计算在的。我们可以参考这个来写一个 arcNestedZoomGrob, 我这里想的是放大的区域和原本扇区相同,这样每一个 sector 就可以避免重叠了, 然后主要思路是绘制 三个图形(上: 原本数据的突出区域, 中: 连接的图形, 下: 放大的区域) 。此外你还需要在放大的区域重新绘制原来图形位置的具体图形。感觉还是比较复杂的。
2arcNestedZoomGrob
参数
arcNestedZoomGrob <- function(x = NULL,y = NULL,
                               start = 60,end = 120,
                               r0 = 0.8,r1 = 1,
                               x0 = 0,y0 = 0,
                               zoom.start = NULL,
                               zoom.end  = NULL,
                               zoom.start.x = NULL,
                               zoom.end.x = NULL,
                               extend.start = 0,
                               extend.end = 0,
                               nested.r = 0.03,
                               panel.gap = 0.02,
                               panel.fun = NULL,
                               zoom.panel.height = NULL,
                               sub.zoom.gap = 3,
                               pos = c("bottom","top"),n = 100,
                               nested.upper.gp = gpar(fill = alpha("white",0.2)),
                               nested.middle.gp = NULL,
                               nested.bottom.gp = NULL,
                               extend.xscale = 0.05,
                               extend.yscale = 0.05,
                               clock.wise = FALSE,
                               name = NULL,gp = NULL, vp = NULL,...)
绘图
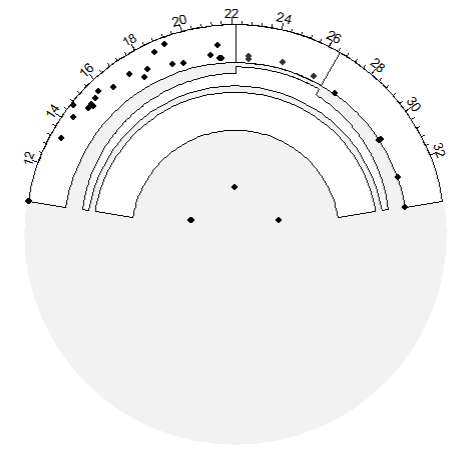
下面我们展示一下 arcNestedZoomGrob 能绘制成什么样,先绘制基本图形:
newpage()
grid.draw(arcSectorGrob(start = 0,end = 180,
                        r0 = 0.8,r1 = 1,
                        add.xaxis = F,add.yaxis = F))
grid.draw(arcPointGrob(x = mtcars$mpg,y = mtcars$disp,
                       start = 0,end = 180,
                       r0 = 0.8,r1 = 1))
grid.draw(arcAxisGrob(start = 0,end = 180,
                      r0 = 0.8,r1 = 1,
                      axis.type = "x",pos = "top",
                      breaks.n = 8,nice.facing = T,
                      xscale = range(mtcars$mpg)))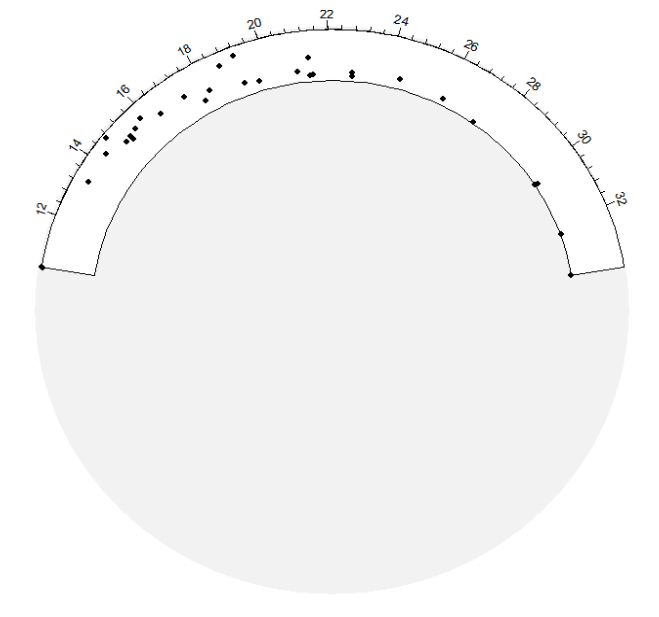
然后指定放大区域 (以具体角度指定):
grid.draw(arcNestedZoomGrob(x = mtcars$mpg,y = mtcars$disp,
                            start = 0,end = 180,
                            r0 = 0.8,r1 = 1,
                            zoom.start = c(30,60,100),
                            zoom.end = c(50,90,130)))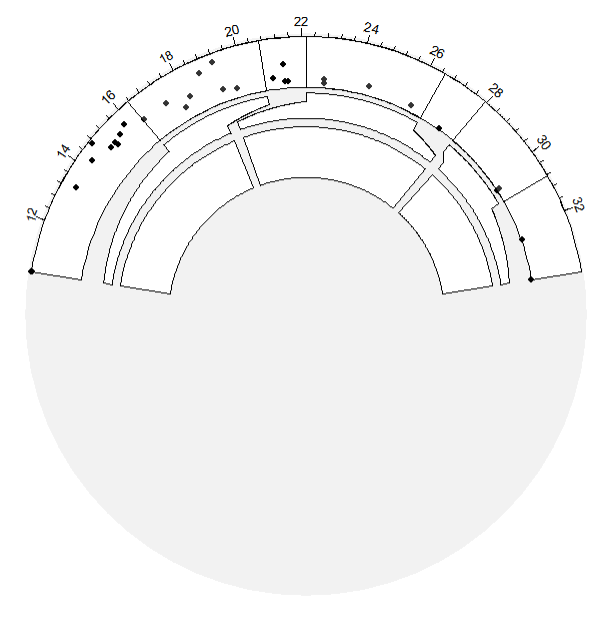
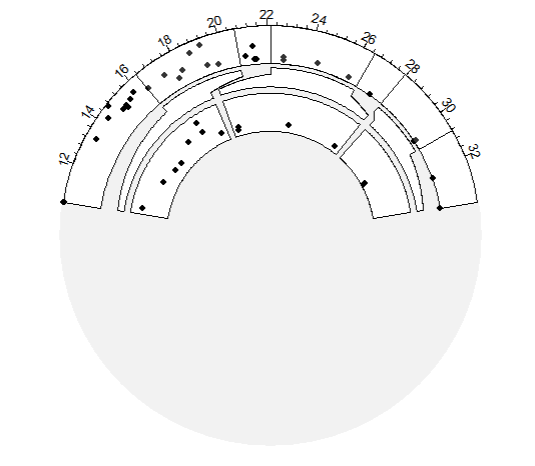
默认是不绘制图形的,你需要指定 panel.fun 参数提供绘图的函数:
grid.draw(arcNestedZoomGrob(x = mtcars$mpg,y = mtcars$disp,
                            start = 0,end = 180,
                            r0 = 0.8,r1 = 1,
                            # clock.wise = T,
                            zoom.start = c(30,60,100),
                            zoom.end = c(50,90,130),
                            panel.fun = function(...){
                              # print(list(...))
                              arcPointGrob(...)
                            }))
假如你要修改 arcPointGrob 的其它参数:
grid.draw(arcNestedZoomGrob(x = mtcars$mpg,y = mtcars$disp,
                            start = 0,end = 180,
                            r0 = 0.8,r1 = 1,
                            zoom.start = c(60),
                            zoom.end = c(90),
                            panel.fun = function(...){
                              args.lst <- list(...)
                              args.lst <- modifyList(args.lst,list(r0 = 0.2,r1 = 0.3))
                              do.call(arcPointGrob,args.lst)
                            }))
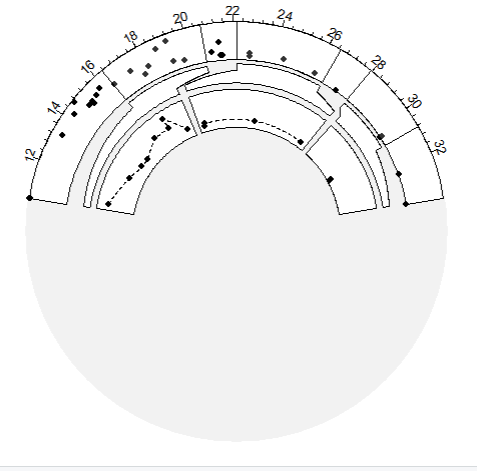
你还可以添加多个图层,用 gList 打包一下:
grid.draw(arcNestedZoomGrob(x = mtcars$mpg,y = mtcars$disp,
                            start = 0,end = 180,
                            r0 = 0.8,r1 = 1,
                            # clock.wise = T,
                            zoom.start = c(30,60,100),
                            zoom.end = c(50,90,130),
                            panel.fun = function(...){
                              gList(arcPointGrob(...),
                                    arcLinesGrob(...,lines.gp = gpar(lty = "dashed")))
                            }))
修改颜色:
grid.draw(arcNestedZoomGrob(x = mtcars$mpg,y = mtcars$disp,
                            start = 0,end = 180,
                            r0 = 0.8,r1 = 1,
                            # clock.wise = T,
                            zoom.start = c(30,60,100),
                            zoom.end = c(50,90,130),
                            panel.fun = function(...){arcPointGrob(...)},
                            nested.upper.gp = gpar(fill = alpha("red",0.2)),
                            nested.middle.gp = gpar(fill = alpha("orange",0.5)),
                            nested.bottom.gp = gpar(fill = alpha("purple",0.5))))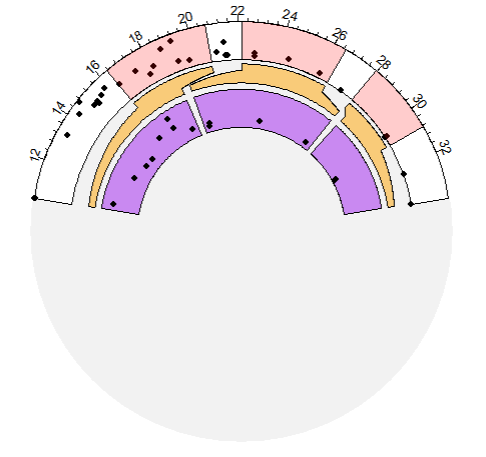
当然你可以指定具体的 x 坐标 (zoom.start.x, zoom.end.x):
grid.draw(arcNestedZoomGrob(x = mtcars$mpg,y = mtcars$disp,
                            start = 0,end = 180,
                            r0 = 0.8,r1 = 1,
                            panel.fun = function(...){arcPointGrob(...)},
                            nested.upper.gp = gpar(fill = alpha("red",0.2)),
                            nested.middle.gp = gpar(fill = alpha("orange",0.5)),
                            nested.bottom.gp = gpar(fill = alpha("purple",0.5)),
                            zoom.start.x = c(12,18,22,30),
                            zoom.end.x = c(15,22,26,30.5)))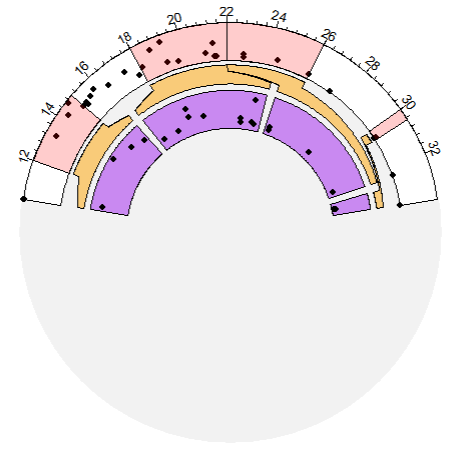
修改位置:
newpage()
grid.draw(arcSectorGrob(start = 0,end = 270,
                        r0 = 0.4,r1 = 0.7,
                        add.xaxis = F,add.yaxis = F))
grid.draw(arcPointGrob(x = mtcars$mpg,y = mtcars$disp,
                       start = 0,end = 270,
                       r0 = 0.4,r1 = 0.7))
grid.draw(arcAxisGrob(start = 0,end = 270,
                      r0 = 0.4,r1 = 0.7,
                      axis.type = "x",pos = "bottom",
                      breaks.n = 8,nice.facing = T,
                      xscale = range(mtcars$mpg)))
grid.draw(arcNestedZoomGrob(x = mtcars$mpg,y = mtcars$disp,
                            start = 0,end = 180,
                            r0 = 0.4,r1 = 0.7,
                            panel.fun = function(...){arcPointGrob(...)},
                            nested.upper.gp = gpar(fill = alpha("red",0.2)),
                            nested.middle.gp = gpar(fill = alpha("orange",0.5)),
                            nested.bottom.gp = gpar(fill = alpha("purple",0.5)),
                            zoom.start.x = c(12,18,22,30),
                            zoom.end.x = c(15,22,26,30.5),
                            pos = "top"))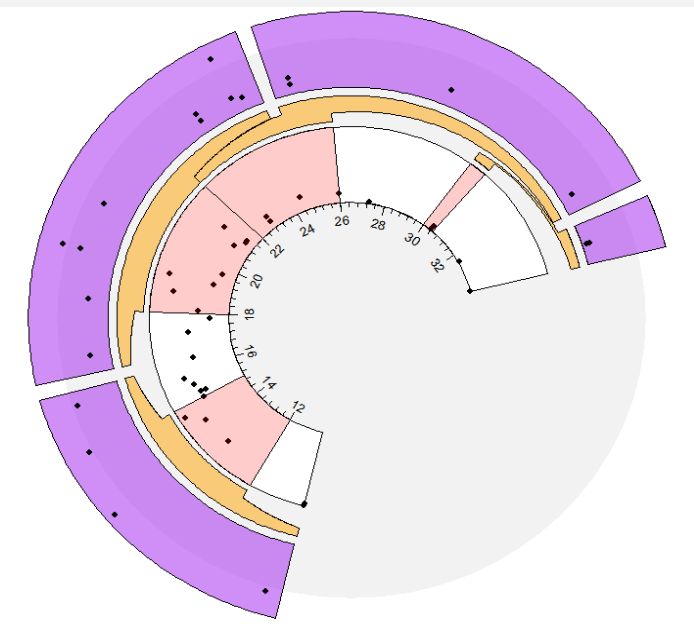
要让它变成一个 geom 图层感觉还没什么思路,关键在那放大区域的图层该怎么写才比较完美。
3结尾
路漫漫其修远兮,吾将上下而求索。
欢迎加入生信交流群。加我微信我也拉你进 微信群聊 老俊俊生信交流群 (微信交流群需收取 20 元入群费用,一旦交费,拒不退还!(防止骗子和便于管理)) 。QQ 群可免费加入, 记得进群按格式修改备注哦。
声明:文中观点不代表本站立场。本文传送门:https://eyangzhen.com/383955.html


