
1引言
详细很多人都在用 pheatmap 这个包绘制热图,简单方便又快捷,但是面对基因名很多时,又想要标记部分基因,事情变得麻烦了起来,为此不得不转向 complexheatmap 稍微难一点的包,网上也有一两篇关于pheatmap 添加部分基因名的教程。正好我前面写过 如何标注部分标签避免重叠并优化优雅的写成 grob?, 直接使用里面的 smartLabelAlignGrob 函数来进行标记, pheatmap 最后会输出 gtable 的对象,我们对这个对象进行编辑重新绘制就可以了。
最后简单的封装成 addMarkers 函数。
2安装
# install.packages("devtools")
devtools::install_github("junjunlab/ggcirclize")

# or
remotes::install_github("junjunlab/ggcirclize")
3使用
我们使用 pheatmap 测试代码画个热图看看:
library(pheatmap)
library(gtable)

test = matrix(rnorm(200), 20, 10)
test[1:10, seq(1, 10, 2)] = test[1:10, seq(1, 10, 2)] + 3
test[11:20, seq(2, 10, 2)] = test[11:20, seq(2, 10, 2)] + 2
test[15:20, seq(2, 10, 2)] = test[15:20, seq(2, 10, 2)] + 4
colnames(test) = paste("Test", 1:10, sep = "")
rownames(test) = paste("Gene", 1:20, sep = "")

# Generate annotations for rows and columns
annotation_col = data.frame(
  CellType = factor(rep(c("CT1", "CT2"), 5)),
  Time = 1:5
)
rownames(annotation_col) = paste("Test", 1:10, sep = "")

annotation_row = data.frame(
  GeneClass = factor(rep(c("Path1", "Path2", "Path3"), c(10, 4, 6)))
)
rownames(annotation_row) = paste("Gene", 1:20, sep = "")

# plot
ht <- pheatmap(test,
               annotation_col = annotation_col,
               annotation_row = annotation_row,
               cutree_rows = 3)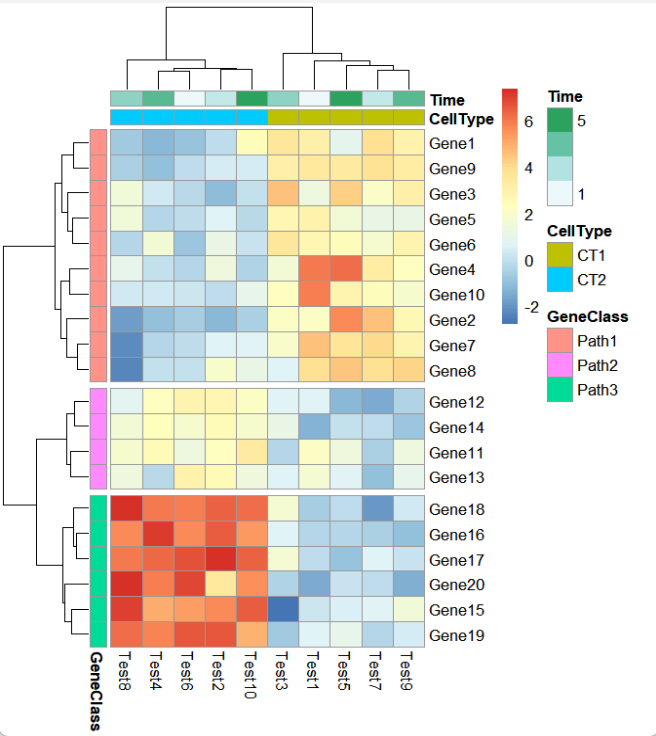

添加感兴趣基因只需要简单的两行代码:
mark.label <- sample(rownames(test),10,replace = F)

addMarkers(object = ht,
           mark.label = mark.label)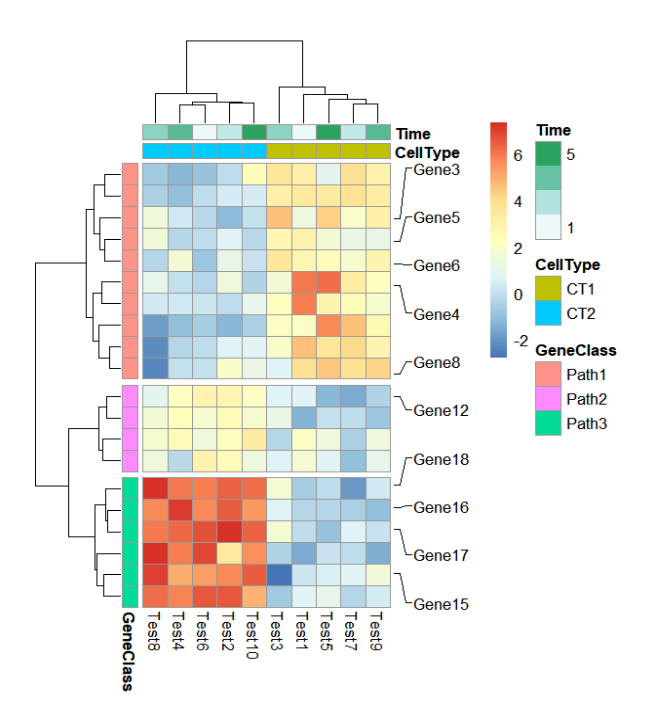
我们随机生成一个大一点的矩阵:
mat <- matrix(rnorm(10000),ncol = 10)
colnames(mat) <- paste0("S",1:10)
rownames(mat) <- paste0("gene",1:1000)

# check
head(mat,3)
#    S1         S2         S3         S4          S5        S6         S7         S8
# gene1  0.7858925  1.7990641  0.2080353 -1.7847507  0.03061643 1.4001735  0.4279207 -0.2252252
# gene2 -0.3529793  0.9338745 -0.7951778  0.7287467  0.95066277 0.5839325 -1.9114439 -0.3958836
# gene3  0.0681392 -1.2909730  0.2422505  1.4172570 -0.04773352 1.0214866  0.5476526 -0.8030118
#    S9        S10
# gene1 -0.139352952 -1.0473017
# gene2  0.983938563 -0.5109047
# gene3  0.002312086 -0.8488603

ht <- pheatmap(mat = mat,cutree_rows = 4)
ht

mark.label <- sample(rownames(mat),15,replace = F)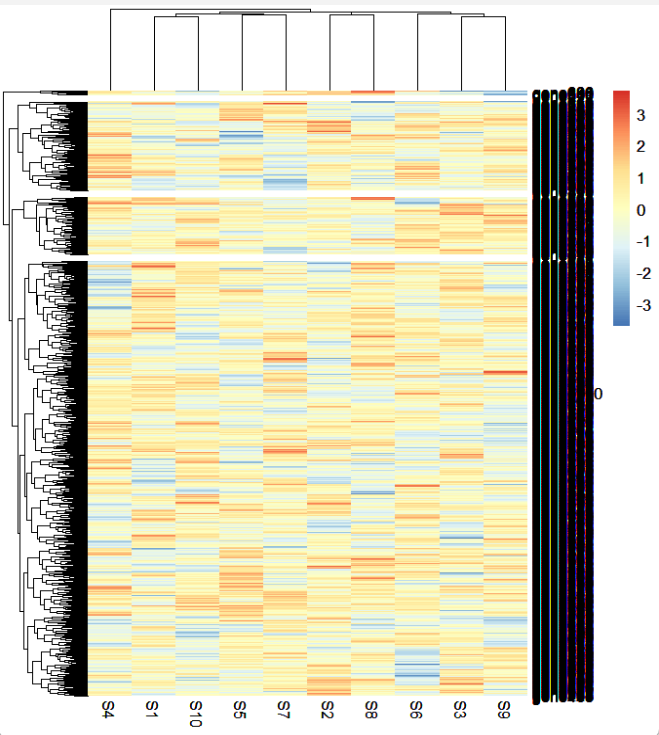
此时的基因已经完全看不清了,我们标记一些基因:
addMarkers(object = ht,
           mark.label = mark.label)
使用 smartAlign2 函数计算标签位置:
addMarkers(object = ht,
           mark.label = mark.label,
           use.smartAlign2 = T)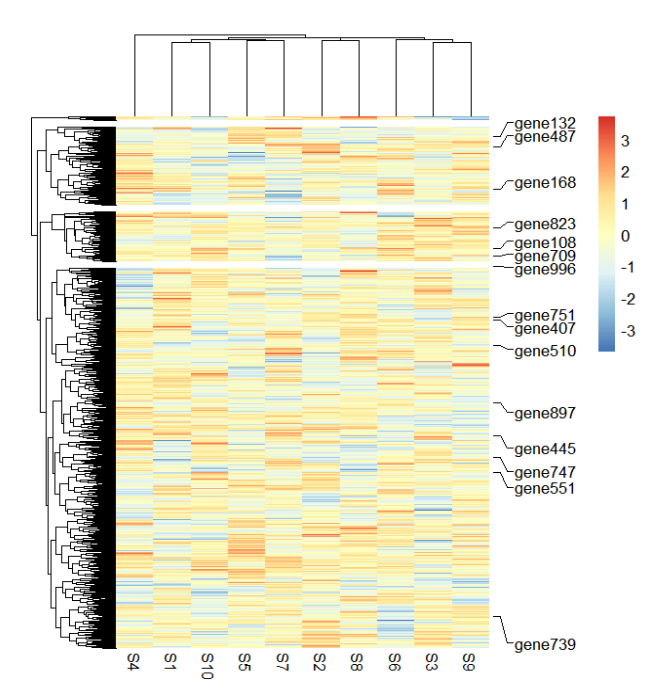
添加箭头:
addMarkers(object = ht,
           mark.label = mark.label,
           link.start.type = "arrow",
           link.end.type = "arrow",
           circle.arrow.size = c(0.05,0.05))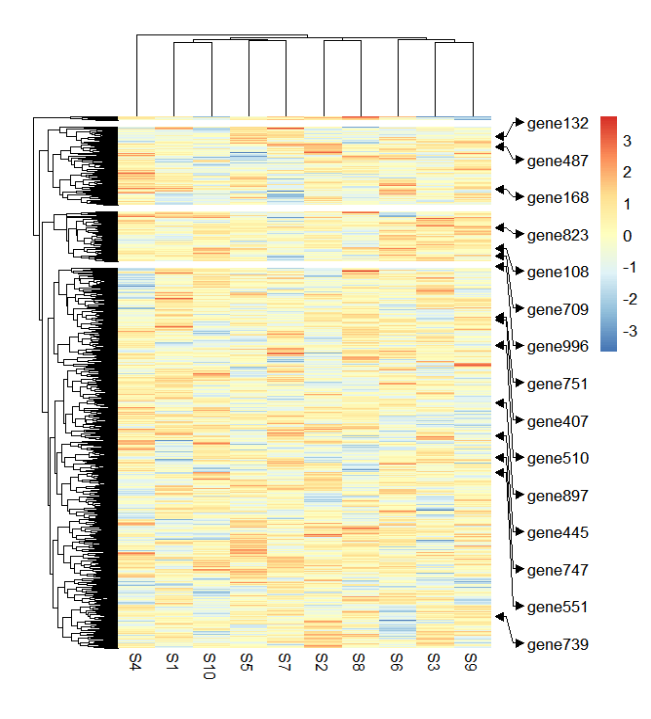
添加端点:
addMarkers(object = ht,
           x = 0.05,
           mark.label = mark.label,
           link.start.type = "circle",
           link.end.type = "circle",
           circle.arrow.size = c(0.05,0.05),
           link.circle.end.gp = gpar(fill = rainbow(15)),
           link.label.gp = gpar(fontface = "bold.italic"),
           link.label.space = 0.1)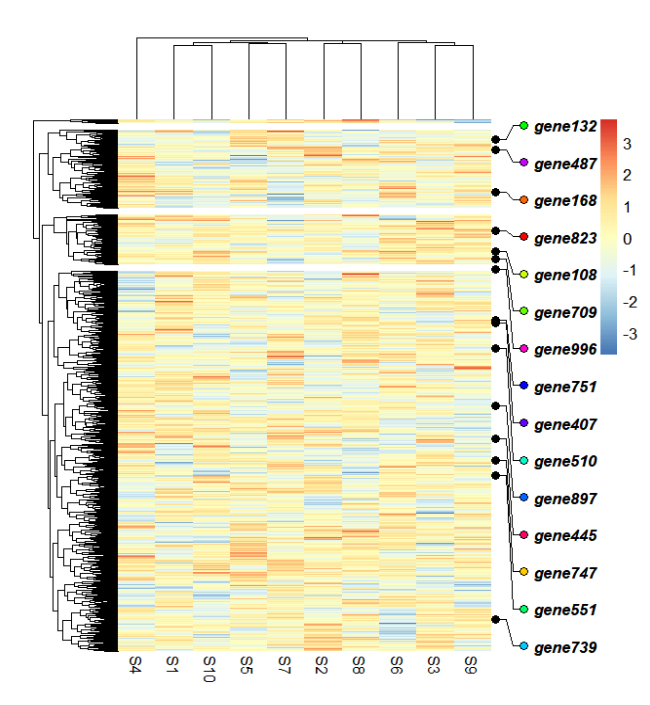
如果你想对样本也进行部分展示当然也是可以的:
mat <- matrix(rnorm(10000),ncol = 100)
colnames(mat) <- paste0("S",1:100)
rownames(mat) <- paste0("gene",1:100)

ht <- pheatmap(mat = mat)
ht

mark.label <- sample(colnames(mat),15,replace = F)

addMarkers(object = ht,
           mark.label = mark.label,
           pos = "bottom")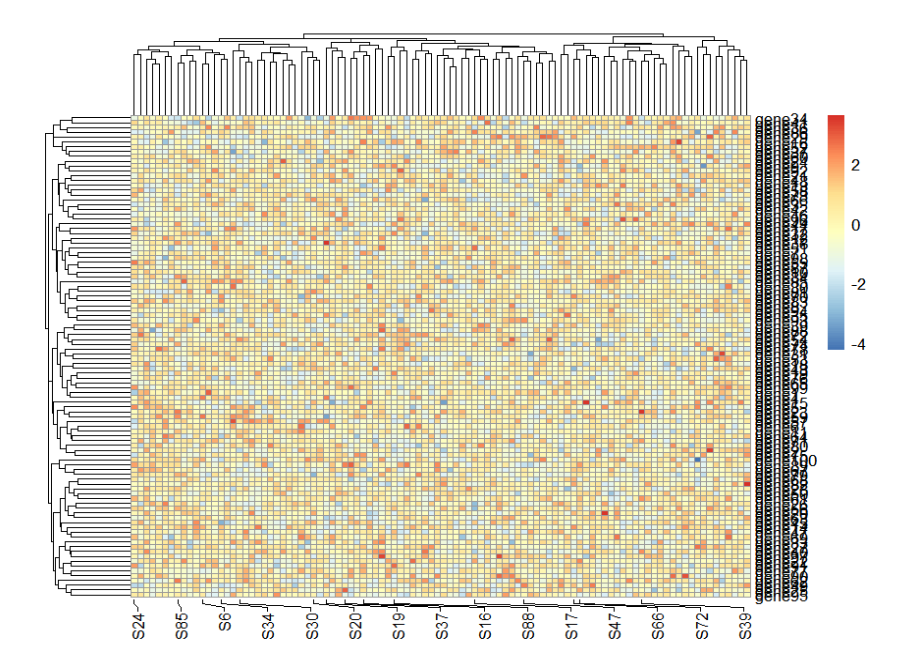
4结尾
路漫漫其修远兮,吾将上下而求索。
欢迎加入生信交流群。加我微信我也拉你进 微信群聊 老俊俊生信交流群 (微信交流群需收取 20 元入群费用,一旦交费,拒不退还!(防止骗子和便于管理)) 。QQ 群可免费加入, 记得进群按格式修改备注哦。
声明:文中观点不代表本站立场。本文传送门:https://eyangzhen.com/386135.html


