
1中奖名单
以下是分享前三的小伙伴,请及时公众号后台联系,发送你的具体收货地址信息,或者微信联系我,预期不候!

2引言
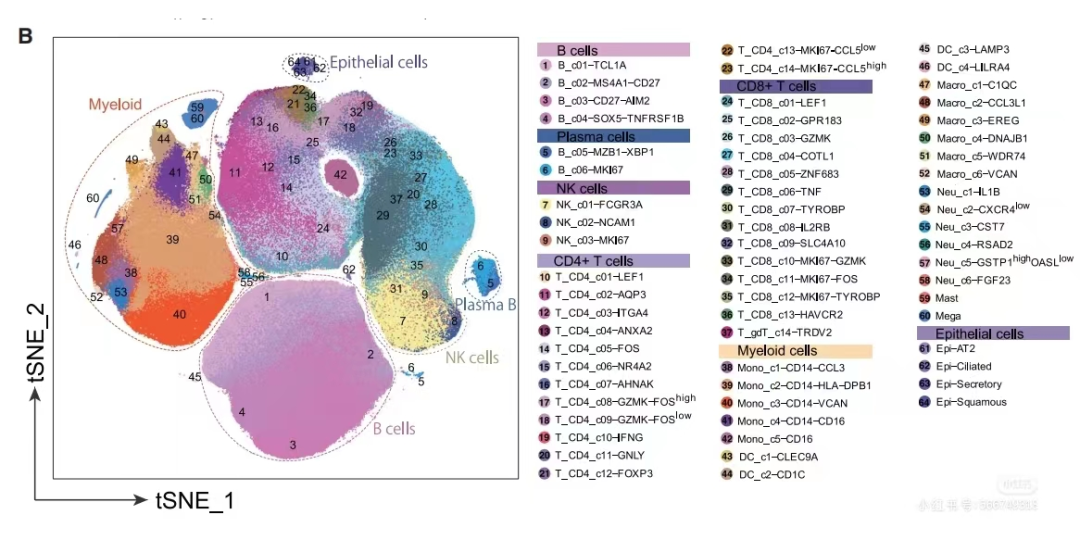
单细胞亚群注释的细胞名称前面往往会有软件分群的结果,也就是前面那个点里面的数字, 重新画个图例就完事了,看看 geom_scPoint2 怎么画出来。
3介绍
默认就和正常的散点图基本差不多:
library(SeuratData)
library(Seurat)
library(ggplot2)
library(ggSCvis)

data("pbmc3k")
pbmc <- pbmc3k.final
pbmc <- UpdateSeuratObject(object = pbmc)

ggscplot(object = pbmc) +
  geom_scPoint2(aes(color = seurat_annotations))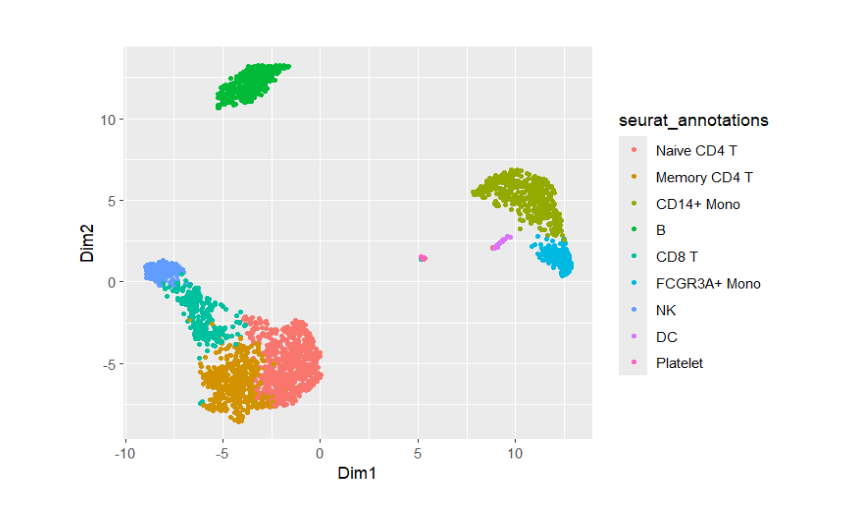
加个亚群标签:
ggscplot(object = pbmc) +
  geom_scPoint2(aes(color = seurat_annotations,
                    cluster = seurat_annotations))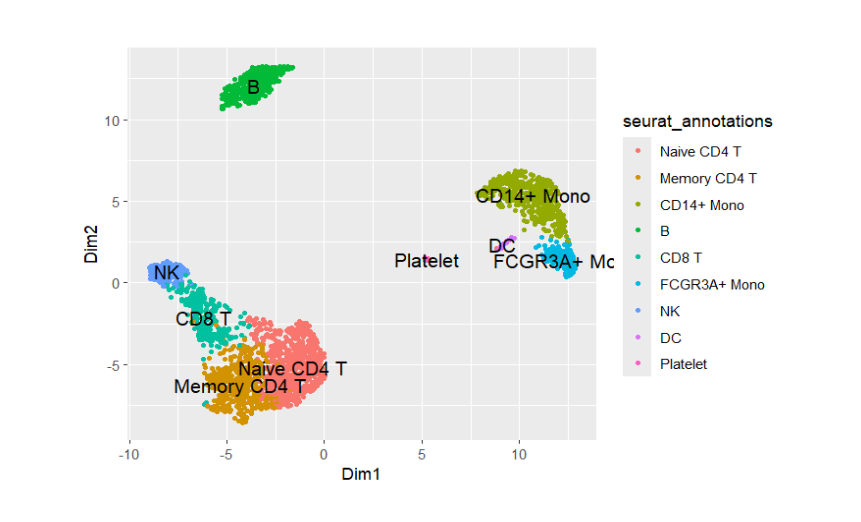
换个主题:
ggscplot(object = pbmc) +
  geom_scPoint2(aes(color = seurat_annotations,
                    cluster = seurat_annotations),
                show.legend = F) +
  theme_sc()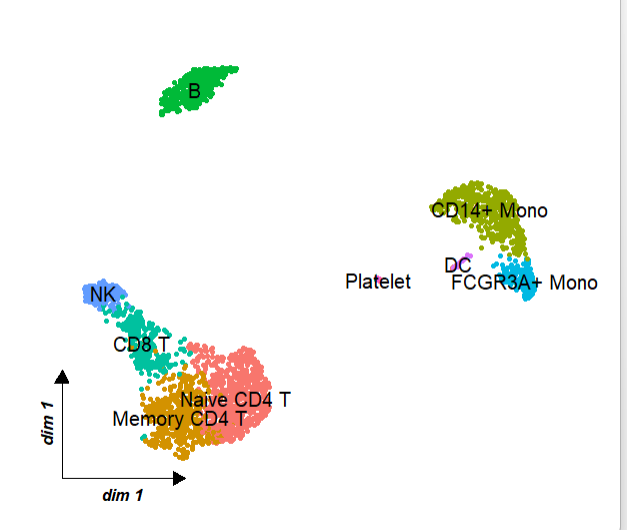
加个新图例,你需要映射 cluster 和 cluster_anno, 代表你的亚群名称 和 亚群编号 的数据:
ggscplot(object = pbmc) +
  geom_scPoint2(aes(color = seurat_annotations,
                    cluster = seurat_annotations,
                    cluster_anno = seurat_clusters),
                show.legend = F,
                add_label = F,
                add_legend = T) +
  theme_sc(r = 0.3)
如果你不知道你数据是哪些,你可以这样查看:
head(ggscplot(object = pbmc)$data,3)
#                     Dim1      Dim2        ident orig.ident nCount_RNA nFeature_RNA seurat_annotations percent.mt RNA_snn_res.0.5
# AAACATACAACCAC -4.232792 -4.152139 Memory CD4 T     pbmc3k       2419          779       Memory CD4 T  3.0177759               1
# AAACATTGAGCTAC -4.892886 10.985685            B     pbmc3k       4903         1352                  B  3.7935958               3
# AAACATTGATCAGC -5.508639 -7.211088 Memory CD4 T     pbmc3k       3147         1129       Memory CD4 T  0.8897363               1
#                seurat_clusters           cell
# AAACATACAACCAC               1 AAACATACAACCAC
# AAACATTGAGCTAC               3 AAACATTGAGCTAC
# AAACATTGATCAGC               1 AAACATTGATCAGC
调整一下位置:
ggscplot(object = pbmc) +
  geom_scPoint2(aes(color = seurat_annotations,
                    cluster = seurat_annotations,
                    cluster_anno = seurat_clusters),
                show.legend = F,
                add_label = F,
                add_legend = T,
                lgd_x = 1.2) +
  theme_sc(r = 0.3)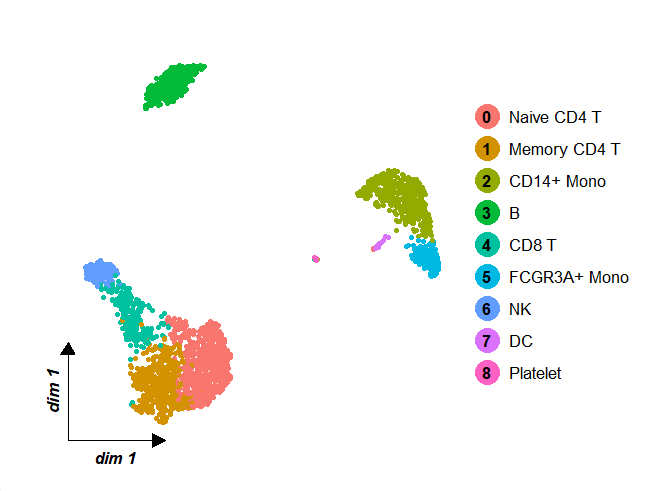
多列也可以:
ggscplot(object = pbmc,b = 0.35) +
  geom_scPoint2(aes(color = seurat_annotations,
                    cluster = seurat_annotations,
                    cluster_anno = seurat_clusters),
                show.legend = F,
                add_label = F,
                add_legend = T,
                lgd_x = 0.5,ncol = 3,lgd_y = -0.25) +
  theme_sc(b = 0.35)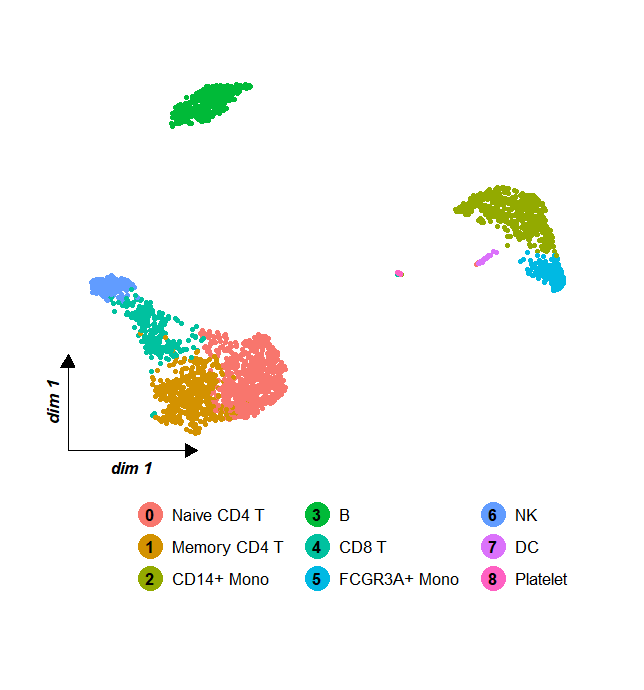
当然还有其它参数来进行细节的调整,间隔,点大小,标签大小,字体等等:
#' @param label.gp A list of graphical parameters for labels (optional).
#' @param add_label Should labels be added to the points (default is TRUE).
#' @param add_legend Should a new legend be added (default is FALSE).
#' @param ncol Number of columns in the legend (default is 1).
#' @param vgap Vertical gap between legend items (default is 0.5).
#' @param hgap Horizontal gap between legend items (default is 1).
#' @param point.size Size of legend points (default is 2).
#' @param point.label.size Size of legend point labels (default is 10).
#' @param point.label.col Color of legend point labels (default is "black").
#' @param lgd_x X-position of the legend (default is 1.05).
#' @param lgd_y Y-position of the legend (default is 0.5).
#' @param lgd_width Width of the legend (default is 0.1).
#' @param lgd_height Height of the legend (default is 0.9).
4结尾
路漫漫其修远兮,吾将上下而求索。
欢迎加入生信交流群。加我微信我也拉你进 微信群聊 老俊俊生信交流群 (微信交流群需收取 20 元入群费用,一旦交费,拒不退还!(防止骗子和便于管理)) 。QQ 群可免费加入, 记得进群按格式修改备注哦。
声明:文中观点不代表本站立场。本文传送门:https://eyangzhen.com/387246.html


