
看到这个R包的论文
Variation in abundance of predicted resistance genes in the Brassica oleracea pangenome
方法部分写到
The R-package regioneR v1.8 (Gel et al., 2016; R Core Team, 2016) was used to test resistance genes and genes exhibiting PAV and transposable elements for association using 500 permutations. For PAV association, the evaluation function numOverlaps was used to check whether the number of gene overlaps is higher than expected. For TE association, the evaluation function meanDistance was used since we do not expect TEs to overlap with RGA candidates due to repeats having been masked during the annotation process
帮助文档
https://bioconductor.org/packages/release/bioc/vignettes/regioneR/inst/doc/regioneR.html
文档里介绍的第一个小例子
Gene promoter regions are GC rich and there are many CpG islands that lie inside promoters. However, is there a statistically significant association between them? Do CpG islands overlap with promoters more than one would expect by chance?
我理解的的大体的意思是 CpG 岛和基因的启动子区互相有重叠,这个重叠的概率是否比随机的大,这个方法会给出一个显著性的P值
需要准备的输入数据
cpg岛的bed文件 (这个文件里不能有表头,需要把表头去掉)
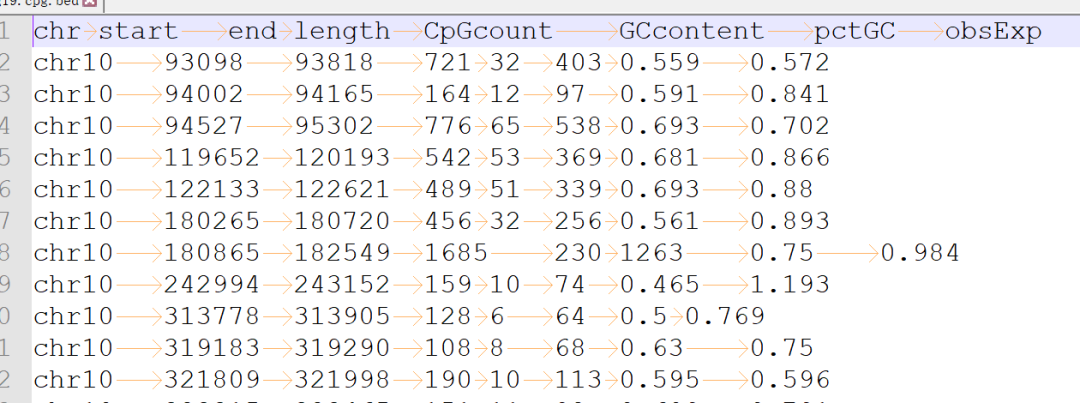

image.png
启动子区的bed文件
image.png
染色体长度的bed文件
image.png
代码
BiocManager::install(“regioneR”)
library(regioneR)
cpgHMM <- toGRanges(“hg19.cpg01.bed”)
cpgHMM
promoters <- toGRanges(“hg19_promoters.bed”)
promoters
cpgHMM <- filterChromosomes(cpgHMM, organism=”hg”, chr.type=”canonical”)
promoters <- filterChromosomes(promoters, organism=”hg”, chr.type=”canonical”)
hg19<-toGRanges(“hg19.tsv”)
cpgHMM_2K <- sample(cpgHMM, 2000)
pt <- overlapPermTest(cpgHMM_2K, promoters,
ntimes=1000,
genome=hg19,
count.once=TRUE)
pt
plot(pt)
会得到一个p值,然后得到一个图
image.png
这个图怎么看暂时没搞懂
示例数据和代码可以给推文打赏一元获取
声明:文中观点不代表本站立场。本文传送门:https://eyangzhen.com/411903.html


