
Heritable microbiome variation is correlated with source environment in locally adapted maize varieties
https://www.nature.com/articles/s41477-024-01654-7
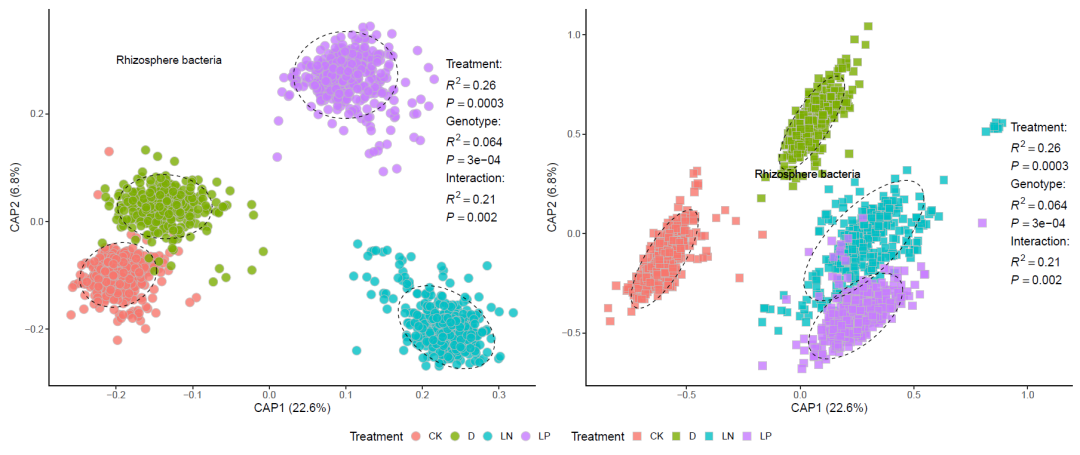
论文中提供了作图用到的原始数据,我们可以试着用原始数据复现论文中的图,今天的推文我们来复现一下论文中的Figure1a
image.png
今天推文比较重要的知识点是
分组添加置信椭圆
在上插入表格
插入表格主要想实现上图文字的效果:插入多行文字,有的文字是常规字体,有的文字带斜体上下标这种
参考这个链接 https://cran.r-project.org/web/packages/gridExtra/vignettes/tableGrob.html
部分示例数据
image.png
加载需要用到的R包
library(readxl)
library(tidyverse)
library(gridExtra)
gridExtra用来在上插入表格
读取数据
read_excel(“D:/R_4_1_0_working_directory/env001/data/20240322/41477_2024_1654_MOESM4_ESM.xlsx”,
sheet = “Fig1a”) -> fig1a.dat
作图代码
fig1a.dat %>%
filter(Compartment==”Rhizosphere”) %>%
ggplot(aes(x=CAP1,y=CAP2))+
geom_point(aes(fill=Treatment),
shape=21,size=5,
color=”gray”,
alpha=0.8)+
stat_ellipse(aes(group = Treatment),
size = 0.5,
level = 0.95,
show.legend = F,
lty=”dashed”)+
labs(x=”CAP1 (22.6%)”,y=”CAP2 (6.8%)”)+
theme_bw(base_size = 15)+
theme(panel.grid = element_blank(),
panel.border = element_blank(),
axis.line = element_line())+
annotate(geom=”text”,x=-0.2,y=0.3,
label=”Rhizosphere bacteria”,
size=5,hjust=0)-> plot.a1
plot.a1
image.png
(论文中的图的配色不是很好看,这里就不改配色了)
添加表格
plot.a1 +
annotation_custom(tableGrob(mytable,rows = NULL,cols = NULL,
theme = ttheme_minimal(core=list(fg_params=list(hjust=0,
parse=TRUE,
x=0,
fontsize=15)))),
xmin=0.25, xmax=0.3, ymin=0, ymax=0.3)
image.png
第二个图也是一样的代码
fig1a.dat %>%
filter(Compartment==”Root”) %>%
ggplot(aes(x=CAP1,y=CAP2))+
geom_point(aes(fill=Treatment),
shape=22,size=5,
color=”gray”,
alpha=0.8)+
stat_ellipse(aes(group = Treatment),
size = 0.5,
level = 0.95,
show.legend = F,
lty=”dashed”)+
labs(x=”CAP1 (22.6%)”,y=”CAP2 (6.8%)”)+
theme_bw(base_size = 15)+
theme(panel.grid = element_blank(),
panel.border = element_blank(),
axis.line = element_line())+
annotate(geom=”text”,x=-0.2,y=0.3,
label=”Rhizosphere bacteria”,
size=5,hjust=0)+
xlim(NA,1.1)+
annotation_custom(tableGrob(mytable,rows = NULL,cols = NULL,
theme = ttheme_minimal(core=list(fg_params=list(hjust=0,
parse=TRUE,
x=0,
fontsize=15)))),
xmin=1.05, xmax=1.1, ymin=0, ymax=0.3) -> plot.a2
组合图
library(patchwork)
pdf(file = “Rplot2.pdf”,width = 18.8,height = 8)
plot.a1+plot.a2+
plot_layout(guides=”collect”)& theme(legend.position = ‘bottom’)
dev.off()

声明:文中观点不代表本站立场。本文传送门:https://eyangzhen.com/414039.html


