
在小红书看到有的人直接截我公众号的图发,所以想看看能不能在图上添加水印,我搜索了一下看有没有现成的R包可以直接做这个事情。找到了一个R包 tracee
https://github.com/cran/tracee/tree/master
这个R包里有一个函数 ggwater()
示例
Genome assemblies of 11 bamboo species highlight diversification induced by dynamic subgenome dominance
https://www.nature.com/articles/s41588-024-01683-0
首先用这篇论文中fig4b的数据做一个散点图和折线图
library(tidyverse)
library(readxl)
fig4b.dat<-read_excel(“data/20240405/41588_2024_1683_MOESM6_ESM.xlsx”,
sheet = “Fig4b”)
fig4b.dat.plot<-fig4b.dat %>%
arrange(Shifted homoeologs) %>%
mutate(Species=factor(Species,levels = Species),
group=c(rep(“A”,3),”B”,”B”,rep(“D”,3))) %>%
ggplot(aes(x=Species,y=Shifted homoeologs))+
geom_path(group=1,lty=”dashed”)+
geom_point(size=10,aes(color=group),show.legend = FALSE)+
theme_bw(base_size = 20)+
theme(panel.grid = element_blank(),
axis.text.x = element_text(angle=60,size=20,
hjust = 1,vjust=1))+
scale_color_manual(values = c(“#0072bd”,”#edb120″,”#77ac30″))
fig4b.dat.plot
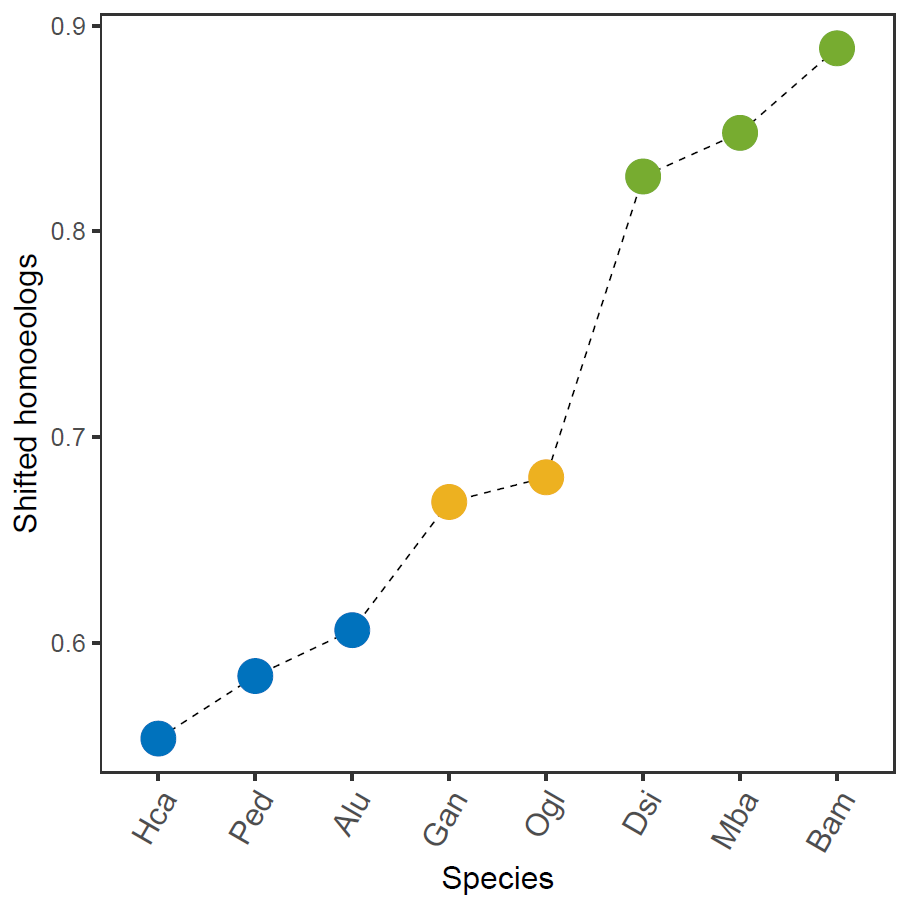

image.png
添加水印
library(tracee)
fig4b.dat.plot+
ggwater(text = “小明的数据分析笔记本”)
image.png
但是没有在ggwater()这个函数里找到调整字体的参数,我们看一下这个函数的代码 https://github.com/cran/tracee/blob/master/R/ggwater.R
可以自己添加一个修改字体的参数
ggwater2 <- function(text=”Not validated”,scale=1,rot=30,col=”grey”,alpha=.5,fontfamily=”KaiTi”){
annotation_custom(grid::textGrob(text, gp = grid::gpar(fontsize = 80*scale,col=col,alpha=alpha,
fontfamily=fontfamily),rot=rot),
xmin = -Inf, xmax = Inf, ymin = -Inf, ymax = Inf)
}
添加水印
ibrary(tracee)
library(extrafont)
cairo_pdf(filename = “Rplot40.pdf”)
fig4b.dat.plot+
ggwater(text = “小明的数据分析笔记本”,
scale = 0.6)
dev.off()
image.png
image.png
欢迎大家关注我的公众号
小明的数据分析笔记本
声明:文中观点不代表本站立场。本文传送门:https://eyangzhen.com/414703.html


