
论文
Genome assemblies of 11 bamboo species highlight diversification induced by dynamic subgenome dominance
https://www.nature.com/articles/s41588-024-01683-0
论文中提供的大部分的作图数据,今天的推文我们来复现一下论文中的Figure 5b
部分示例数据截图
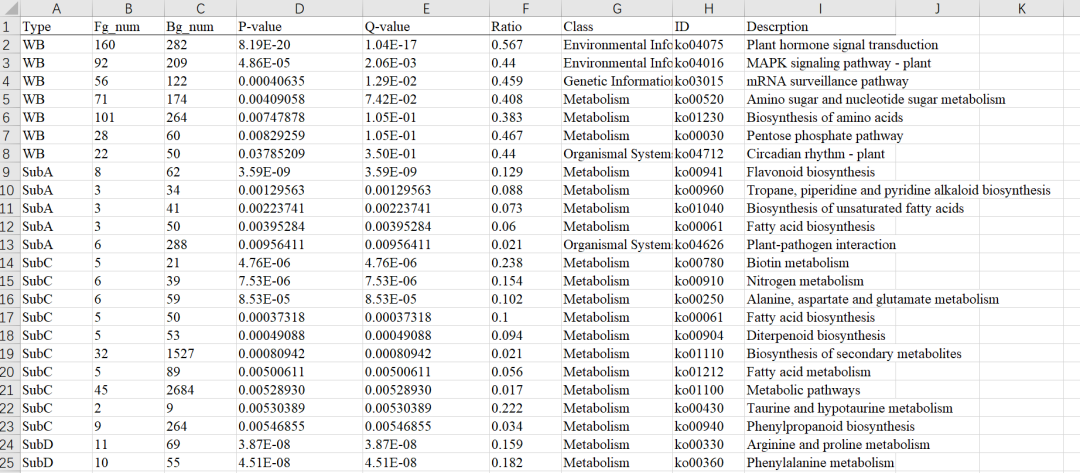

image.png
读取数据
library(readxl)
library(tidyverse)
?read_excel
fig5b.dat<-read_excel(“data/20240405/41588_2024_1683_MOESM7_ESM.xlsx”,
sheet = “Fig5b”)
fig5b.dat
数据预处理
myfun<-function(x){
return(str_replace_all(x,”-“,”_”))
}
fig5b.dat %>%
rename_with(myfun) %>%
mutate(Type=str_replace(Type,pattern = “Sub”,””),
y=nrow(.):1,
Q_value=as.numeric(Q_value)) -> fig5b.dat.01
fig5b.dat %>%
rename_with(myfun) %>%
mutate(Type=str_replace(Type,pattern = “Sub”,””),
y=nrow(.):1,
Q_value=as.numeric(Q_value)) %>%
group_by(Type) %>%
summarise(max_value=max(y),
min_value=min(y)) %>%
ungroup() -> fig5b.dat.02
数据预处理的代码主要做的事儿是 添加一列用于作图的Y轴,把数据标题里的连接符-换成下划线;构造数据用来画图中的颜色条
作图代码
ggplot()+
geom_segment(data=fig5b.dat.01,
aes(x=0,xend=-log(Q_value,20),
y=y,yend=y))+
geom_point(data=fig5b.dat.01,
aes(x=-log(Q_value,20),
y=y,
size=log10(Fg_num),
color=Type))+
geom_rect(data=fig5b.dat.02,
aes(xmin=0,xmax=-1,ymin=min_value-0.5,ymax=max_value+0.5,
fill=Type))+
geom_text(data=fig5b.dat.02,
aes(x=-0.5,y=(min_value+max_value)/2,label=Type),
angle=90,size=5)+
scale_y_continuous(breaks = 1:35,
labels = fig5b.dat.01$Descrption,
expand = expansion(mult = c(0,0)))+
theme_bw(base_size = 20)+
theme(panel.grid = element_blank(),
panel.border = element_blank(),
axis.ticks.y = element_blank())+
labs(x=expression(-Log20),y=NULL)+
scale_x_continuous(expand = expansion(mult = c(0,0.1)))+
coord_cartesian(clip = “off”)+
scale_size_continuous(breaks = c(0.5,2),
name = expression(Log10),
labels = c(“Min:0.5″,”Max:2.0”))+
guides(fill=”none”,
color=”none”,
size=guide_legend(nrow = 1,
title.position = “top”,
title.hjust = 0.5))+
theme(legend.position = “bottom”,
legend.justification = 0)+
scale_fill_manual(values = c(“PSG”=”#c15259”,
“D”=”#609c64”,
“C”=”#6da6c2”,
“A”=”#90be4e”,
“WB”=”#a1a1a1”))+
scale_color_manual(values = c(“PSG”=”#c15259”,
“D”=”#609c64”,
“C”=”#6da6c2”,
“A”=”#90be4e”,
“WB”=”#a1a1a1”))
image.png
纵坐标轴的文本部分部分改成黑体用代码如何来实现暂时想不到了,出图后手动编辑吧
声明:文中观点不代表本站立场。本文传送门:https://eyangzhen.com/414825.html


